NEAR Sinks 12% Onto Its 200-Day SMA as Key Fibonacci Support Gives Way
Key Takeaways
- •NEAR broke below the 0.618 Fibonacci retracement near $3.23 on Friday, the band floor flagged in a November 18 Coindoo analysis, and fell to a session low of $2.76.
- •The token traded near $2.83 at 21:42 UTC, down 11.94% on the day and roughly 15% below its November 18 level, as the wider crypto market sold off with Bitcoin dipping toward $60,000.
- •Friday's low stopped just above the rising 200-day simple moving average near $2.74, which sits about 3% below the current price and now acts as the nearest support.
- •The falling 50-day average at $4.34 has dropped about eight cents in two days and is closing in on the still-rising 100-day at $3.55, though no bearish crossover has occurred yet.
- •The descending channel in place since late October remains intact, and its lower line is set to converge with the 0.786 retracement near $2.48 within days if the channel holds its shape.
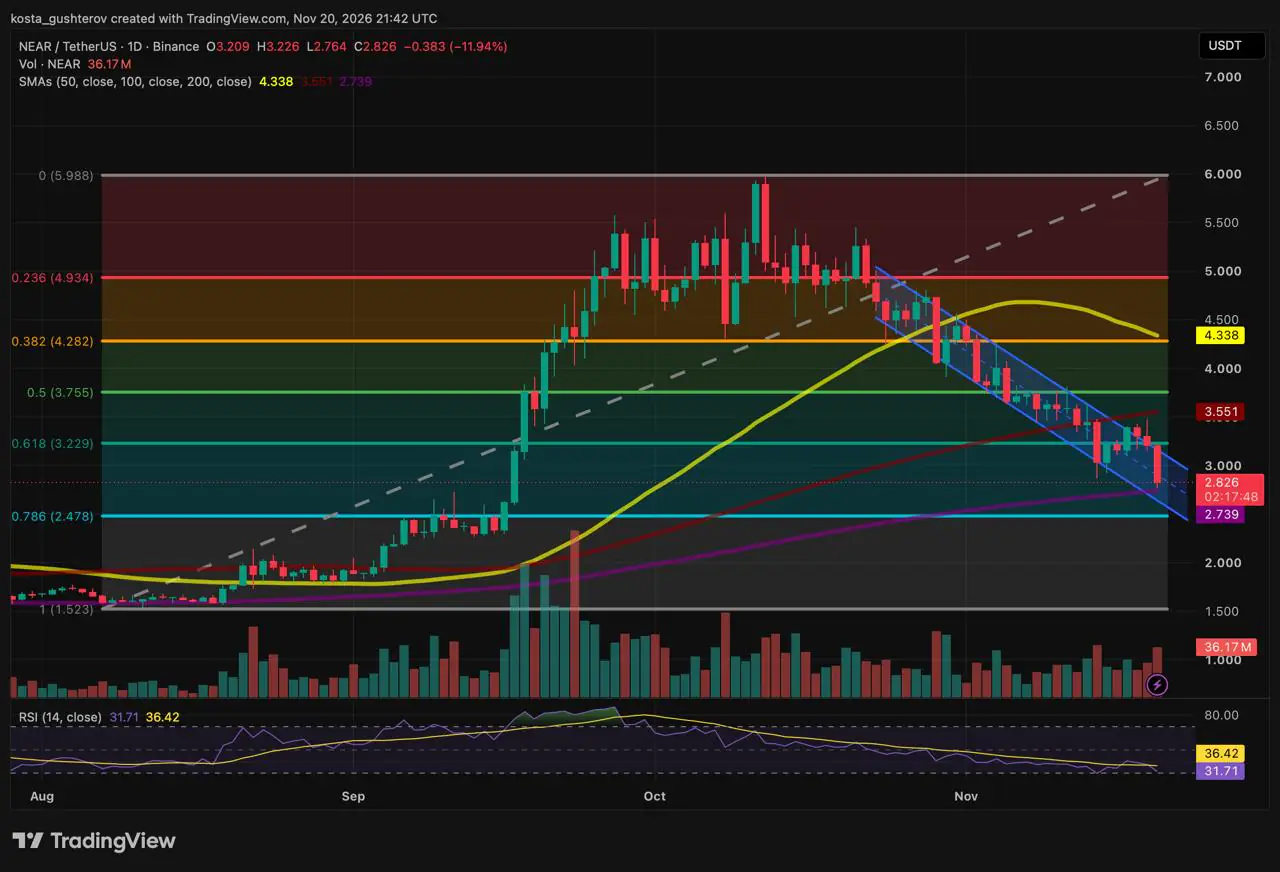
NEAR's closely watched three-level squeeze came to an end on Friday, as a sharp sell-off drove the token through the 0.618 Fibonacci retracement near $3.23 — the level that a Coindoo analysis published two days earlier had identified as the floor of a 29-cent band. Fibonacci retracements — standard ratios projected between a swing low and a swing high — are among the most widely used reference zones in technical analysis, levels where traders watch for stalls or reversals, which is why the band's floor was the focus of that earlier analysis.
Several markers defined the session: Friday's high stopped just under the 0.618, the price sits about 3% above the 200-day simple moving average (SMA), the relative strength index (RSI) stands near 31.7 — not yet oversold, a designation conventionally reserved for readings below 30 — and heavy selling volume appeared about two hours before the close.
Out of the Bottom of the Band
When the November 18 analysis ran, NEAR traded at $3.34, squeezed between the 0.618 retracement below, the 100-day average above and the upper edge of a descending channel.
On Thursday, a push higher briefly poked above the channel line before closing back inside at $3.21, just under the 0.618. Friday opened at that level and reached $3.226 — less than a cent below the 0.618 at $3.229 — before the selling began. The session low came at $2.76.
As of 21:42 UTC, with roughly two hours left in the daily session, NEAR traded at $2.83, down 11.94% on the day and about 15% below its level on November 18. The decline came as the broader crypto market sold off, with Coindoo's same-day coverage recording Bitcoin dipping toward $60,000 at the US market open.
Resting on the 200-Day
The November 18 piece laid out what a loss of the 0.618 would expose: the rising 200-day average, then the 0.786 retracement beneath it. NEAR is now at the first of those levels. The 200-day has crept up from $2.72 to $2.74 since then, and Friday's low stopped just above it. The 200-day is one of technical analysis's most closely followed trend gauges, commonly read as a rough dividing line between longer-term uptrends and downtrends, and tests of it after pullbacks of this size tend to draw attention for exactly that reason.
The averages above price point in different directions. The 50-day, at $4.34, is falling and sits near the 0.382 retracement at $4.28, making that zone the highest resistance band on the chart. The 100-day, at $3.55, is still rising, as is the 200-day. No bearish crossover has occurred between any of them yet, but the 50-day has dropped about eight cents in two days and is closing in on the 100-day from above — and crossovers between a faster and a slower average are among the most closely watched momentum signals in chart analysis, giving that narrowing gap significance beyond the individual levels themselves.
NEAR now trades 53% below its mid-October high near $5.99.
Inside the Channel
The descending channel that began in late October remains intact. Every rally since then has stopped at its upper line — Thursday's included — and Friday's high formed where that line runs just under the 0.618. Price now sits in the lower half of the channel.
The channel's lower line runs below the 200-day and slopes down toward the 0.786 level, meaning the two will converge within days if the channel holds its shape.
What Sits Below the 200-Day
The levels under the 200-day correspond to two phases of the rally. The 0.786 near $2.48 falls within the September shelf, where NEAR traded between $2.40 and $2.50 before its mid-September breakout. The $2.20 level marks the lower part of that consolidation. The full retracement near $1.52 corresponds to the August low from which the entire Fibonacci grid is drawn. Those correspondences are what give the levels below their weight — they mark ranges where trading previously concentrated, which is why chartists treat them as candidate support rather than arbitrary lines.
Three Paths From Here
For now, the nearest support is the 200-day, about 3% below the current price, while the nearest resistance is the 0.618, roughly 14% above. Within the framework laid out on November 18, the sessions ahead turn on three observable markers: whether price holds or gives way at the rising 200-day, where the channel's lower line meets the 0.786 — a convergence the channel's geometry puts within days — and whether the 50-day's slide completes the first bearish crossover among the averages. Each is a chart condition to be confirmed or refuted by future sessions, not a forecast.
Chart data: NEAR/USDT daily, Binance, via TradingView, captured November 20, 2026, at 21:42 UTC with the daily candle still open. The Fibonacci retracement is drawn from the August low to the mid-October high.
This article is for informational purposes only and is not financial, investment or trading advice. The levels and scenarios describe chart conditions, not price predictions. Cryptocurrencies are highly volatile; do your own research before making any decision.

