Morpho Price Erases Its Breakdown in a Single 15% Candle
Key Takeaways
- •MORPHO rose roughly 15.2% to $2.40 on Saturday after touching an intraday high of $2.51, reversing a week of losses in a single session.
- •October's correction had pushed the token through its 50-day ($2.42), 100-day ($2.31) and 200-day ($2.14) moving averages before buyers stepped in near the 0.500 Fibonacci retracement at $1.98.
- •Saturday's rally crossed four levels in one session — the 200-day average, the 0.382 Fibonacci level near $2.22, the 100-day average and the 50-day average — before stalling at the 0.236 Fibonacci level near $2.52.
- •The three moving averages remain in bullish order within a band roughly $0.29 wide, so a daily close above the 50-day near $2.42 would put price back above all three at once.
- •A daily close above $2.52 could open the way toward October swing highs near $2.80 and the September peak around $3.01, while a close back below the 200-day at $2.14 would cancel the recovery and put $1.98 back in play.
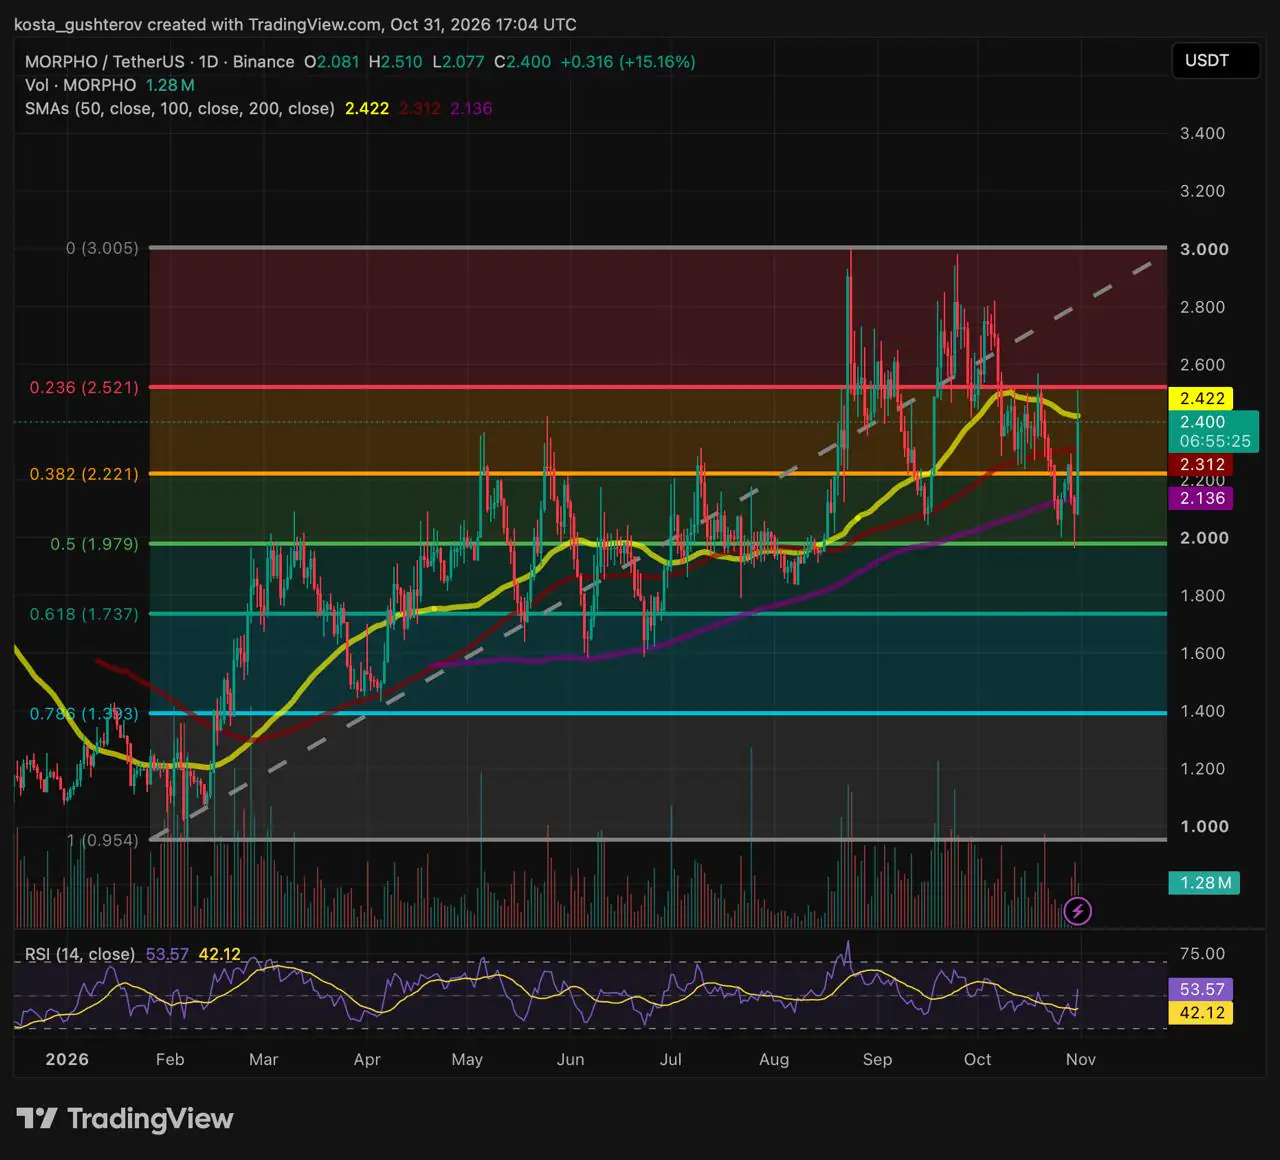
MORPHO traded at $2.40 at 17:04 UTC on Saturday, up about 15.2%, or $0.32, on the day after reaching $2.51, according to the Binance MORPHO/USDT daily chart. MORPHO is the token of Morpho, a decentralized lending protocol in the DeFi sector. The single-session advance erased a week of losses, lifted the token back above the 200-day and 100-day moving averages, and stalled at the 0.236 Fibonacci level, leaving the 50-day average near $2.42 as the last major average overhead.
A week of losses, then a floor
October's correction carried MORPHO through all three of its main moving averages in quick succession: the 50-day at $2.42 first, then the 100-day at $2.31, and finally the 200-day at $2.14 — the long-term trend filter that price had not traded below in months. Moving averages like these track the average closing price over their period and are widely watched as dynamic support and resistance. The decline found its floor near the 0.500 Fibonacci retracement at $1.98, just under the round $2.00 level. On this chart, the Fibonacci grid measures the token's entire run from its February low near $0.95 to its September peak around $3.01, making $1.98 the midpoint of the year's advance. Retracement grids of this kind are used by traders to map where pullbacks within an established trend tend to stall. Buyers stepped in there.
Four crossings in one candle
Saturday's candle opened at $2.08, with its low sitting essentially at the open, and converted the drop into a V-shaped reversal. From there, price crossed four levels in a single session.
First came the 200-day moving average, which moved back beneath price just one day after giving way. Second was the 0.382 Fibonacci level near $2.22, the horizontal pivot positioned between the averages. Third was the 100-day average, putting MORPHO back above two of its three key averages. Fourth was the 50-day, which was pierced but not held — the rally carried price above it to $2.51 and stopped exactly beside the 0.236 Fibonacci level near $2.52. Price has since settled at $2.40, just under the 50-day.
If the day closes with those gains intact, the dip below the 200-day would resemble a bear trap: a breakdown that drew sellers in around $2.00 before reversing hard, which could also force traders who sold the breakdown to buy back their positions. The candle is still open, so for now the recovery is strong but unconfirmed.
Three averages, one tight band
Even at yesterday's low, the moving averages preserved their bullish order, with the 50-day above the 100-day and the 100-day above the 200-day. All three sit inside a band roughly $0.29 wide, about 13% of price. That proximity gives the 50-day outsized importance: one daily close above it would put price back above all three at once.
A rhythm since February
Across the year, MORPHO has followed a recurring pattern of sharp rallies followed by deep pullbacks in April, June, August and now late October, with each correction tending to bottom at a Fibonacci tier higher than the one before. Yesterday's low near the 0.500 level fits that sequence, though past swings set no rule for the next one.
Where the levels sit
Measured from $2.40, the 50-day average lies less than 1% above, while the $2.51–$2.52 ceiling, where Saturday's rally stopped, sits about 5% higher. Beyond it lie the October swing highs near $2.80, roughly 17% above, and the September peak around $3.01, about 25% higher and aligned with the psychological $3.00 mark.
To the downside, the 100-day average sits about 4% below, the 0.382 level about 7.5% lower and the 200-day about 11% lower. The 0.500 level near $1.98 lies about 17.5% below current price. Further down are the 0.618 golden pocket near $1.74, which held as the floor of the June–July consolidation; the 0.786 level near $1.39; and the February low near $0.95.
What the close decides
If buyers hold the 100-day at $2.31 into the close and then push through the 50-day at $2.42 and Saturday's high, a daily close above the 0.236 level near $2.52 would clear the entire cluster of averages and horizontal resistance, returning price to the broken dashed rising trendline. That could open a move toward the October swing highs near $2.80 and a retest of the September peak around $3.01.
If sellers keep price capped within the $2.42–$2.52 band, a pause below it would not, by itself, undo the move. The recovery stays intact as long as any pullback holds a higher low above the 100-day and the 0.382 level near $2.22. A daily close back below the 200-day at $2.14 would cancel Saturday's recovery and put the midpoint near $1.98 back in play.
This article is provided for informational purposes only and does not constitute financial or investment advice. Technical levels and scenarios do not guarantee future price movement.

