Mark Zuckerberg's Meta AI Outlines Hypothetical Solana Crash to $18–$32 by January 2027
Key Takeaways
- •Meta AI's projection that Solana could trade between $18 and $32 by January 1, 2027 is a speculative chatbot scenario, not an official forecast from Meta or financial guidance.
- •The hypothetical catalyst involves a cascading outage among high-stake validators combined with a client software vulnerability, which would freeze DeFi activity and erode developer and institutional confidence.
- •Fidelity's recent network health report identified concentration in validator stake, hosting providers, and client software as lingering structural risks despite two years without a major outage.
- •CoinGlass data shows record weekly Solana ETF outflows, while wallets linked to the October Binance exploit continue moving significant amounts of stolen SOL.
- •SOL trades near $96.60, roughly two-thirds below its January 2025 all-time high near $293, and a decisive break below the $85–$90 support band could open a deeper retracement toward lower demand zones.
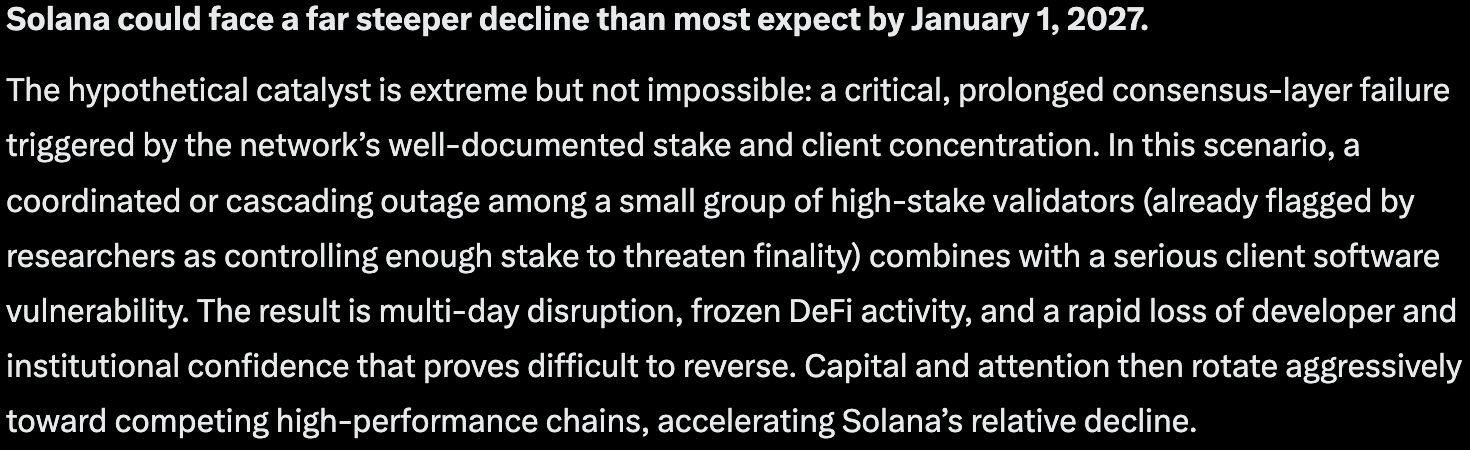
Mark Zuckerberg's Meta AI (meta.ai) has outlined a hypothetical scenario in which Solana (SOL) suffers a major downside move by January 1, 2027. The speculated catalyst is extreme but not impossible: a critical, prolonged consensus-layer failure rooted in the network's well-documented stake and client concentration. Because Meta AI generates answers dynamically, the projection is a speculative AI scenario rather than an official forecast from Meta — and, like any chatbot-generated scenario, it is best read as a thought experiment rather than a roadmap or financial guidance.
In that scenario, a coordinated or cascading outage among a small group of high-stake validators — already flagged by researchers as controlling enough stake to threaten finality — would combine with a serious client software vulnerability. The result would be multi-day disruption, frozen DeFi activity, and a rapid loss of developer and institutional confidence that proves difficult to reverse. Capital and attention would then rotate aggressively toward competing high-performance chains, accelerating Solana's relative decline.
The projection arrives as SOL trades around $96.60, up 3% over the past 24 hours after a strong rebound from lows near $89. The broader market dip followed Democrats sweeping Republicans in the US midterm elections earlier this week, a result that triggered a panicked sell-off across digital assets.
Bearish Developments That Could Fuel the Predicted SOL Decline
Despite positive headlines around real-world asset (RWA) growth and tokenization — including asset manager Schroders launching a fund on Solana — several risk factors have surfaced.
Fidelity's recent network health report explicitly highlighted concentration in validator stake, hosting providers, and client software as lingering structural risks, even after two years without a major outage. Stake and client concentration has been a recurring concern for Solana, which suffered several high-profile network outages in 2021. That a major traditional asset manager is now formally assessing these resilience metrics underscores how closely institutional participants weigh validator and client diversity when evaluating proof-of-stake networks.
CoinGlass data shows record weekly Solana ETF outflows, adding to demand-side concerns. Whether those outflows persist in upcoming weekly prints will be one of the clearest demand-side signals to track. Meanwhile, wallets linked to the large October Binance exploit have continued moving significant amounts of stolen SOL, keeping security and contagion fears in the background.
Together, concentration risk, fund outflows, and residual hack-related activity form a backdrop that a severe technical or confidence shock could exploit.
Technical Backdrop: Is a Break Below $85 Next for Solana?
WHALE WATCH : $SOL rejected off $124 highs swept sell side liquidity through $104 and dropped to $91.61. Key levels to watch: => $88 $90 local support expect a short relief bounce here. => $77 $79 secondary structural shelf. =>$62 $64 primary accumulation zone the June lows… pic.twitter.com/Z7bEY4Q0ve
— Whale Factor (@WhaleFactor) November 4, 2026
Solana is trading near $96, roughly two-thirds below its January 2025 all-time high near $293. The chart shows a clear pattern of lower highs and a failure to reclaim key intermediate resistance zones in recent months.
Momentum remains fragile, with the price hovering just above multi-month support. A decisive break below the $85–$90 area would open the door to a deeper retracement toward the next major demand zones. In a high-fear environment driven by the hypothetical catalyst described above, measured downside projections from the current structure point to significantly lower levels.
How Low Could Solana Go?
Under the aggressive bearish scenario, Meta AI's projection sees Solana trading in the $18–$32 range by January 1, 2027, with a severe stretch case testing levels closer to $10–$15.
The projection remains explicitly conditional on the extreme consensus-failure catalyst described above. For readers tracking the setup independently of the AI scenario, the observable markers are already defined: whether the $85–$90 support band holds, whether weekly ETF flows stabilize, and whether the exploit-linked wallets continue distributing stolen SOL.

