Litecoin Rises 20% as Network Activity and Derivatives Trading Accelerate
Key Takeaways
- •Litecoin climbed approximately 20% during the September 24 session, reaching an intraday high near $74.70 on Binance after breaking above the $60.60 resistance that had capped its price through most of September.
- •The Litecoin Foundation reported on September 23 that more than 17 million LTC, worth over $1 billion in adjusted economic volume, moved across the network in 24 hours, a meaningful but not record figure compared with the roughly $2.51 billion May peak.
- •Twenty-four-hour futures volume reached about $1.97 billion versus roughly $373 million in tracked spot turnover, with open interest near $690 million and liquidations totaling only about $4.87 million, indicating heavy derivatives participation.
- •Available data cannot establish a short squeeze as the rally's primary cause, since CoinGlass did not provide a reliable long-versus-short liquidation split and no major protocol launch was announced.
- •Daily RSI reached approximately 84.5 and price stood about 44% above the 50-day moving average, so a close below $60.60 would weaken the breakout and shift attention toward the $57.50-$58 area.
Litecoin’s breakout draws attention as trading activity surges
Litecoin (LTC) climbed approximately 20% during the September 24 session, reaching an intraday high near $74.7 after breaking above the previous $60.6 ceiling. The move followed a report from the Litecoin Foundation that more than $1 billion in adjusted economic volume had moved across the network, while derivatives activity increased as the price advance accelerated.
No single announcement fully explains the rally. The available evidence points instead to three developments arriving in sequence: LTC moved above resistance near $60.6, the Litecoin Foundation highlighted more than $1 billion in adjusted network volume, and futures activity expanded as the breakout gained speed.
Litecoin moved above $60.60, ending the range that had contained its price through much of September. On September 23, the Litecoin Foundation reported increased network activity, giving traders a fundamental data point to associate with the breakout. The September 24 daily candle then accelerated toward $75 while futures turnover approached $2 billion.
The timing does not prove that the network data caused the entire rally. By the time the chart was captured, Litecoin had not announced a major protocol launch or another event that required investors to buy LTC. The performance was nevertheless notable because it occurred while Bitcoin and several large cryptocurrencies were under pressure. Coindoo’s examination of the broader crypto-market decline linked that weakness to rising yields, renewed oil-price pressure and profit-taking after the previous rally.
What the 17 million LTC network figure means
On September 23, the Litecoin Foundation reported that more than 17 million LTC, worth over $1 billion, had moved across the network during the preceding 24 hours. The Foundation described the figure as adjusted economic volume. Its post is available on X.
Launched in 2011, Litecoin is among the longest-running cryptocurrencies and is commonly described as a payments-oriented network, making on-chain transfer volume a natural gauge of actual use for the asset.
Seventeen million LTC represents roughly 22% of Litecoin’s circulating supply. That does not mean that 22% of all coins changed owners, nor does it show that investors purchased $1 billion worth of LTC. The same coins can move more than once, and on-chain transfers do not reveal whether a sender sold, reorganized custody or moved funds between services.
The Foundation’s figure also did not separate merchant payments, exchange transfers, institutional movements and other transaction types. It confirms substantial network use, but it cannot identify who transferred the coins or why.
The number also needs to be viewed in context. The largest daily reading reported in May reached approximately $2.51 billion. The latest figure is meaningful, but it is not a record for the year.
Price breaks out, but momentum is stretched
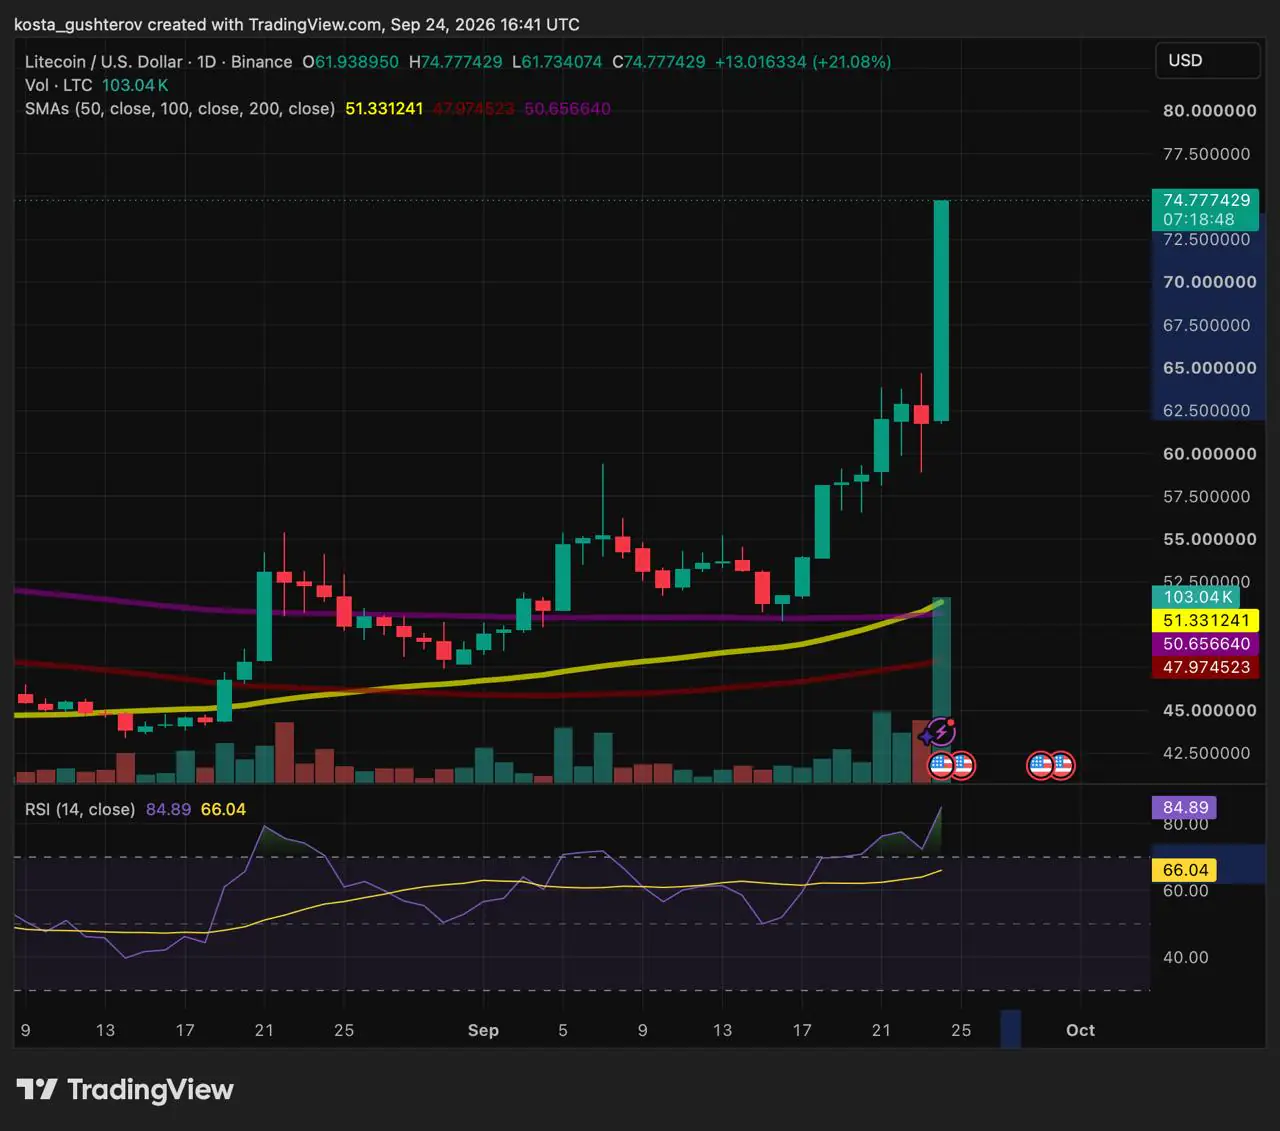
On the Binance LTC/USD daily chart, Litecoin opened near $61.94, briefly slipped to $61.70 and then reached $74.70. It was trading near $74 at 16:40 UTC, leaving the unfinished candle approximately 20% above its opening level. The chart is available through TradingView.
Volume had reached approximately 101,300 LTC, visibly exceeding during most recent sessions. Because the daily candle was still open, its price, volume and indicator readings could change before the close.
The first nearby resistance test was the $74.50-$75 area, which combines the session high with a round-number price marker. On the downside, the more informative zone sat between approximately $60.60 and $62.50. The lower boundary marks the former range ceiling, while the upper boundary covers the base of the latest vertical move. The zone is not confirmed support unless buyers successfully defend it during a pullback.
A close below $60.60 would place LTC back inside its former range and weaken the breakout. If that occurs, the September price step around $57.50-$58 would become the next visible area to examine.
Moving averages show transition rather than full alignment
Litecoin was trading above all three major daily moving averages:
- 50-day average: approximately $51.3
- 100-day average: approximately $47.9
- 200-day average: approximately $50.6
The 50-day average had moved slightly above the 200-day average, a development often called a golden cross. However, the 100-day average remained below both. The structure was improving, but the three averages had not formed a fully ordered long-term bullish alignment.
Price was also approximately 44% above the 50-day average. That gap illustrated the speed of the advance, while leaving the moving averages too far below the market to guide the next short-term reaction.
Futures activity followed the breakout
When checked, CoinGlass showed approximately $1.97 billion in 24-hour LTC futures volume, compared with about $373 million in tracked spot turnover. Open interest, the total value of derivative positions still open, stood near $690 million, and recorded liquidations totaled approximately $4.87 million. The relevant market data is available from CoinGlass.
Futures volume was more than five times the displayed spot volume. Futures markets permit leveraged positions, which can amplify turnover during fast price moves. That comparison indicates heavy derivatives participation, although the panels may cover different venues and instruments and should not be treated as a precise market-wide ratio.
The data does not prove that a short squeeze caused the 20% gain. CoinGlass did not provide a reliable long-versus-short liquidation split in the captured reading. Without that breakdown, it is impossible to determine how much of the buying came from forced short closures.
The relatively limited liquidation total compared with overall futures turnover suggests that more than automatic position closures was involved. New speculative positions, discretionary buying and market makers responding to the price move may all have contributed, but the available figures cannot distinguish among them.
The first pullback will test the breakout
In a higher-range scenario, LTC could correct while holding the $60.60-$62.50 breakout area. That would show that buyers were willing to defend prices above the former September range.
In a failed-breakout scenario, LTC could close below $60.60 as volume and derivatives activity fade. That would place the price inside its previous range and turn attention toward $57.50-$58.
Daily RSI reached approximately 84.5 during the unfinished candle. An RSI above 70 describes unusually rapid upside momentum, but it does not guarantee an immediate reversal. Strong trends can remain overbought, although the probability of sharp intraday swings generally rises once price becomes this extended.
The network-activity figure helps explain why Litecoin attracted fresh attention, while the move through $60.60 provided a level around which traders could act. Derivatives activity appears to have amplified the move, but the available liquidation data does not establish a squeeze as its primary cause.
The first pullback, rather than the size of the day’s candle, will indicate whether Litecoin has entered a higher trading range. As that test approaches, whether volume and open interest expand, hold steady or fade alongside price will offer a running read on whether new participation is backing the move. Cryptocurrency prices, technical indicators and derivatives data can change rapidly. This article is provided for informational purposes only and does not constitute financial or investment advice.
Source: Coindoo.

