Chainlink Clears All Major Daily Moving Averages as LINK Nears $10
Key Takeaways
- •Standard Chartered forecast LINK at $13 by the end of 2026 and $200 by 2030, but the article says the forecast alone does not establish causation for the rally.
- •LINK traded around $8.22 to $8.26 when the forecast was published and rose about 6% the following day.
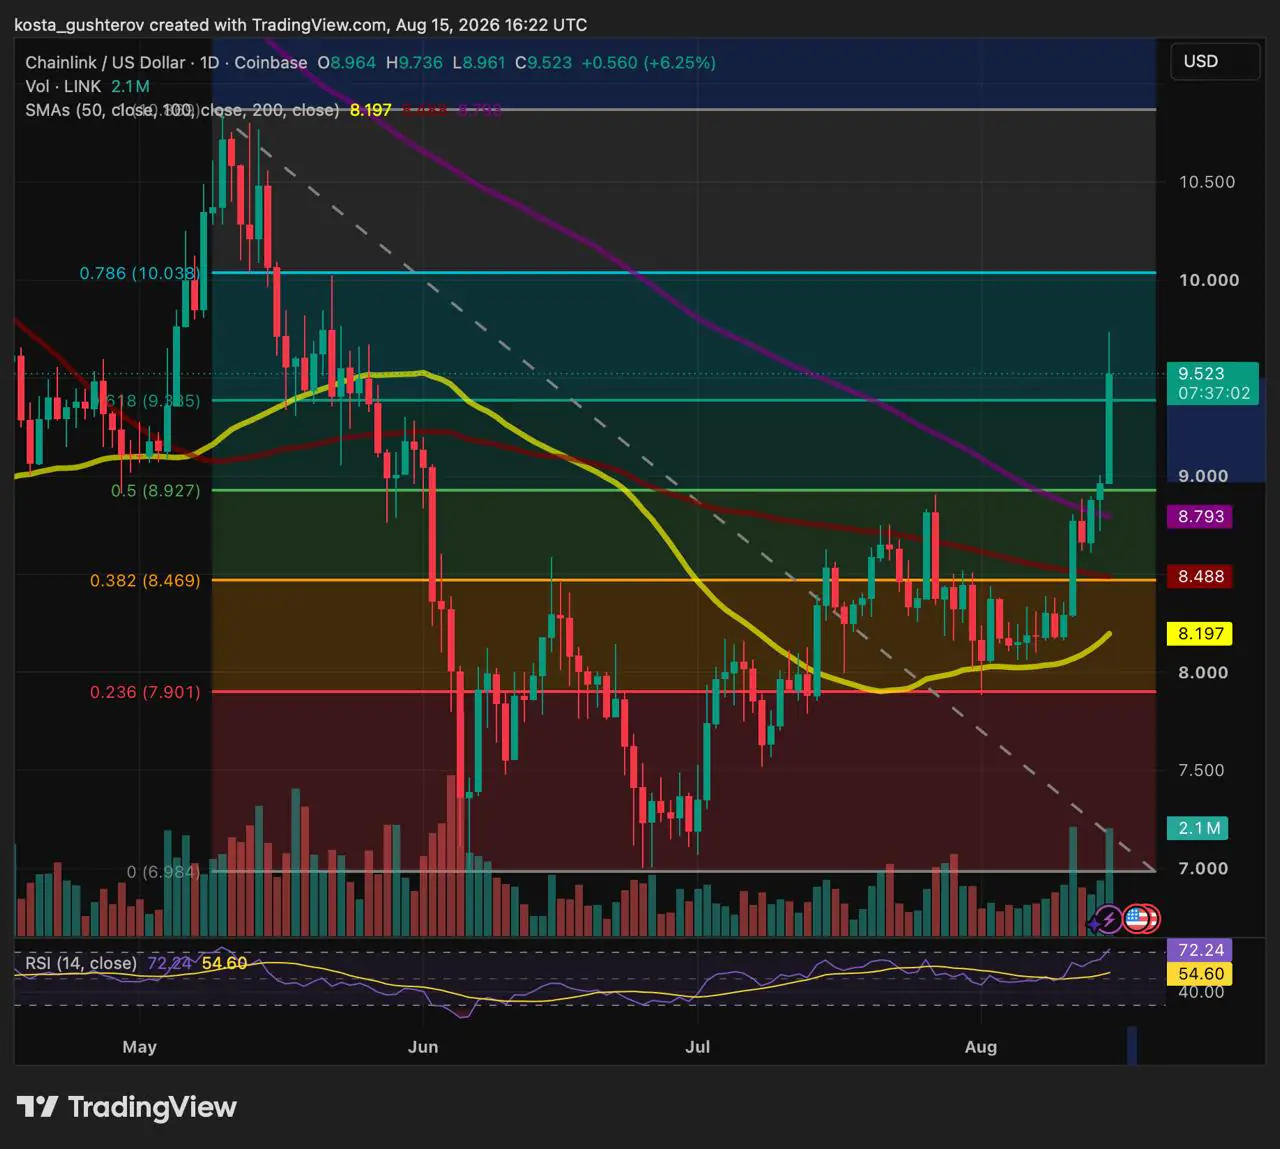
- •The token has moved above the 50-day, 100-day, and 200-day simple moving averages, and the $8.80-$9 area is described as a new support zone.
- •LINK has also broken above the 0.618 Fibonacci retracement near $9.4, while the next notable resistance is around the $10 level.
- •Daily RSI is about 72 and volume reached 2.1 million LINK, indicating the move has become stretched while the daily candle remains open.
Standard Chartered Forecast Preceded the Move
Standard Chartered's August 10 forecast set targets of $13 for LINK by the end of 2026 and $200 by 2030, but the market showed no immediate reaction. The call came from one of the large global banks active in digital-asset research, and its targets stretch years out, far beyond the daily-chart timeframe driving the current move. LINK itself is the payment token for Chainlink, a decentralized oracle network that delivers off-chain data such as asset prices to smart contracts. On the day the forecast was published, LINK traded between roughly $8.22 and $8.26, below the 0.382 Fibonacci retracement and the 100-day simple moving average. While the forecast came before the rally, the timing alone does not show that it caused the buying.
The first response arrived one day later. LINK gained about 6%, cleared the upper edge of its late-July range, and reached the 200-day SMA. As our previous Chainlink analysis explained, the 200-day average and the 0.5 Fibonacci retracement near $8.9 still stood in the way.
LINK spent the following sessions around that cluster, then moved above the 0.5 level and accelerated on August 15. The latest daily candle opened near $8.95, reached $9.7, and was trading around $9.5 at the time of writing.
New Support Zone Emerges at $8.80-$9
The daily chart shows LINK now above the 50-day SMA at $8.20, the 100-day SMA at $8.5, and the 200-day SMA at $8.8. Those three averages are among the most widely followed trend benchmarks in technical analysis, which is why standing above all of them at once is the kind of milestone chart watchers track. The 200-day average sits just below the 0.5 Fibonacci retracement at $8.9, forming the cluster that capped the earlier advance. LINK has cleared both levels and pushed through the 0.618 retracement near $9.4. The retracement levels are drawn from ratios in the Fibonacci sequence, a standard tool for mapping potential support and resistance between a swing high and low.
Because the August 15 candle is still open, the move above $9.4 remains intraday for now. A daily close above that level would strengthen the break, but only a later defense of the level could confirm it as support. Falling back below $9.4 would be less decisive, since the stronger support band lies between roughly $8.80 and $9, where the 200-day SMA, the 0.5 retracement, and the former price ceiling overlap.
A pullback into that band followed by a recovery would leave the structure intact, showing that buyers are willing to defend former resistance. A daily close below the 200-day SMA near $8.8 would be more damaging and would bring $8.5 back into focus. That lower cluster contains the 0.382 retracement and the 100-day SMA and marks the top of the old range.
$10 Is Next, but Momentum Is Already Stretched
The 0.786 Fibonacci retracement sits at $10, almost exactly on the psychological $10 level. The same area acted as a pivot during the May decline. A break above it would leave the May reference high near $11 as the next visible level.
Daily RSI has risen to about 72, above the conventional overbought threshold of 70. That reading does not predict an immediate reversal, but it shows how quickly the move has become extended. Volume had reached 2.1 million LINK, already elevated compared with many recent sessions. Both readings remained incomplete, with several hours left before the daily close.
Technical indicators and price levels describe current market conditions and do not guarantee future performance. Market data can change quickly, particularly before a daily candle closes. This article is for informational purposes only and is not investment advice.

