Justin Sun Reveals 80–90% Ethereum Sale as ETH Slides Below $2,450
Key Takeaways
- •Justin Sun sold approximately 80–90% of his Ethereum holdings in November and December 2025 at prices between $3,600 and $4,000, and has not repurchased the tokens.
- •Sun directed the sale proceeds into.S. equities, including Nvidia and holdings linked to the Nasdaq 100, while maintaining his core Bitcoin position.
- •Sun attributed the exit to a weak double-top pattern formed by Ethereum's August peak near $4,957 and October high near $4,755, questioning the strength of demand from ETFs and large investors.
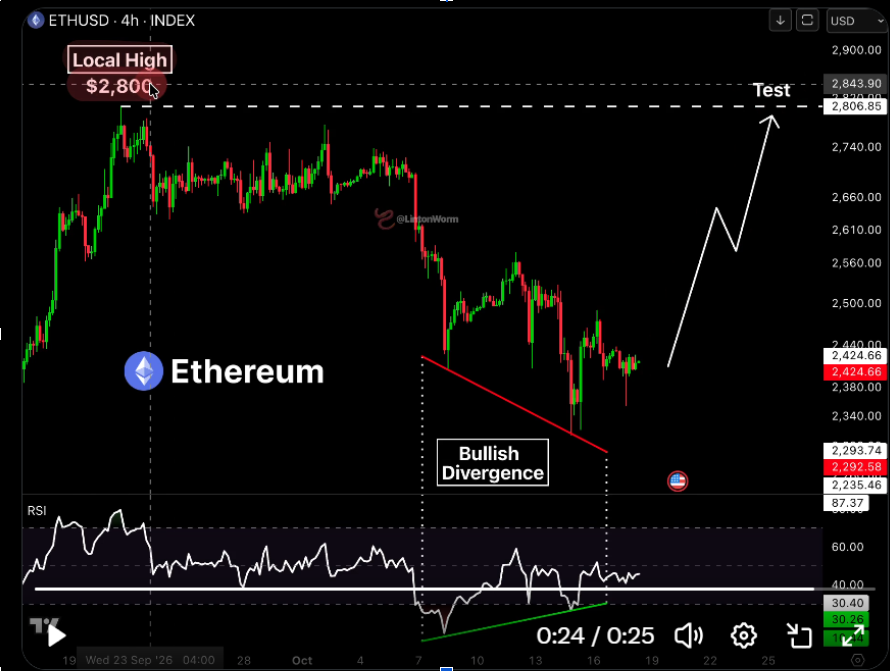
- •A bullish RSI divergence on the four-hour chart points to fading downward momentum, with a rebound scenario targeting $2,800 and invalidation near $2,300.
- •Analyst Ted warned that a weekly close below $2,450 could trigger another correction, though he described the broader range as a potential accumulation area for long-term holders.
TRON founder Justin Sun has disclosed that he sold roughly 80–90% of his Ethereum holdings in late 2025, exiting the position at prices between $3,600 and $4,000 before moving the proceeds into U.S. equities. The admission, highlighted by WuBlockchain on X, lands as Ethereum struggles to recover from its October correction, with ETH closing near $2,409 on October 18 and remaining below the $2,450 level that technical analysts are monitoring. Disclosures of this kind tend to draw close attention in crypto markets, where participants track the positioning of prominent large holders as one of several gauges of sentiment — and the reported exit range sits well above the levels at which Ether currently trades.
Attention now centers on two competing technical readings: a bullish RSI divergence on the four-hour chart that points to fading downward momentum, and a weekly structure that one analyst warns remains vulnerable to further losses.
Sun Details Late-2025 Ethereum Exit
Sun discussed the sales in an October interview, saying he reduced his Ethereum exposure around November and December 2025. Ether had previously represented his largest cryptocurrency position. He placed the transactions in a $3,600 to $4,000 price range and has not repurchased the Ethereum he sold.
Rather than rotating back into crypto, Sun directed the capital toward U.S. equities, including technology companies. His disclosed stock exposure includes Nvidia and holdings linked to the Nasdaq 100.
Sun attributed the reduction to his view of Ethereum's price structure at the time. In his assessment, the asset's two major peaks formed a weak double top — a pattern traders generally read as a potential bearish reversal once it is confirmed: ETH approached $4,957 in August 2025 before registering another high near $4,755 in October. He questioned the strength of the second advance, citing demand from exchange-traded funds and large investors; such funds have offered U.S. investors listed Ether exposure since spot Ether ETFs began trading there in 2024. Notably, Sun maintained his core BTC holdings throughout the same period, a detail that frames the sale as specific to Ether rather than a wholesale step back from cryptocurrency.
Bullish Divergence Builds Below $2,800
Ethereum's four-hour chart shows a developing bullish divergence between price action and the relative strength index (RSI). Price established lower lows during its recent decline, while the RSI formed higher lows — opposing movements that suggest downward momentum has weakened, even as the token remains under pressure. The latest RSI reading still sits below the neutral midpoint. Divergences of this kind are widely used momentum signals, though traders generally treat them as tentative until price action confirms the shift.
The chart places Ethereum near $2,425 after a series of failed rebounds, and buyers have yet to establish a sustained move above nearby trading levels. Under the setup, a recovery through $2,500 would bring the $2,600 area into focus before a possible retest of the previous local high near $2,800.
The projected rebound remains conditional. The chart marks $2,800 as its upside target and roughly $2,300 as the level that would invalidate the bullish setup. A fall beneath that lower boundary would weaken the divergence-based recovery scenario, even if the RSI continues to improve.
Weekly Chart Points to Correction Risk
Crypto analyst Ted (@TedPillows on X) offered a more cautious assessment, saying Ethereum looked weak on the four-hour chart and that he expected a weekly close below $2,450. Such a close, he warned, could lead to another correction — a view that differs from the shorter-term rebound projection, which depends on buyers defending support around $2,300. The split reflects a familiar tension in technical analysis, in which higher-timeframe charts are typically used to frame the broader trend while lower timeframes capture shorter-term shifts in momentum.
The weekly chart shows ETH pulling back after failing to sustain its latest move toward the $2,800 resistance region. An initial support area sits near $2,356, with another marked level around $1,966. If Ethereum price eventually clears its first barrier, the chart identifies a higher resistance level near $3,447.
Despite the near-term caution, Ted described the broader price range as a potential accumulation area long-term holders.
This article is for informational purposes only and does not constitute financial or investment advice. Cryptocurrency markets involve substantial volatility and potential capital losses. Investors should conduct independent research and consult a qualified financial adviser before making investment decisions.

