PPI Inflation Is in the Revisions: Prior-Month Services PPI and Core PPI Massively Revised Higher
Key Takeaways
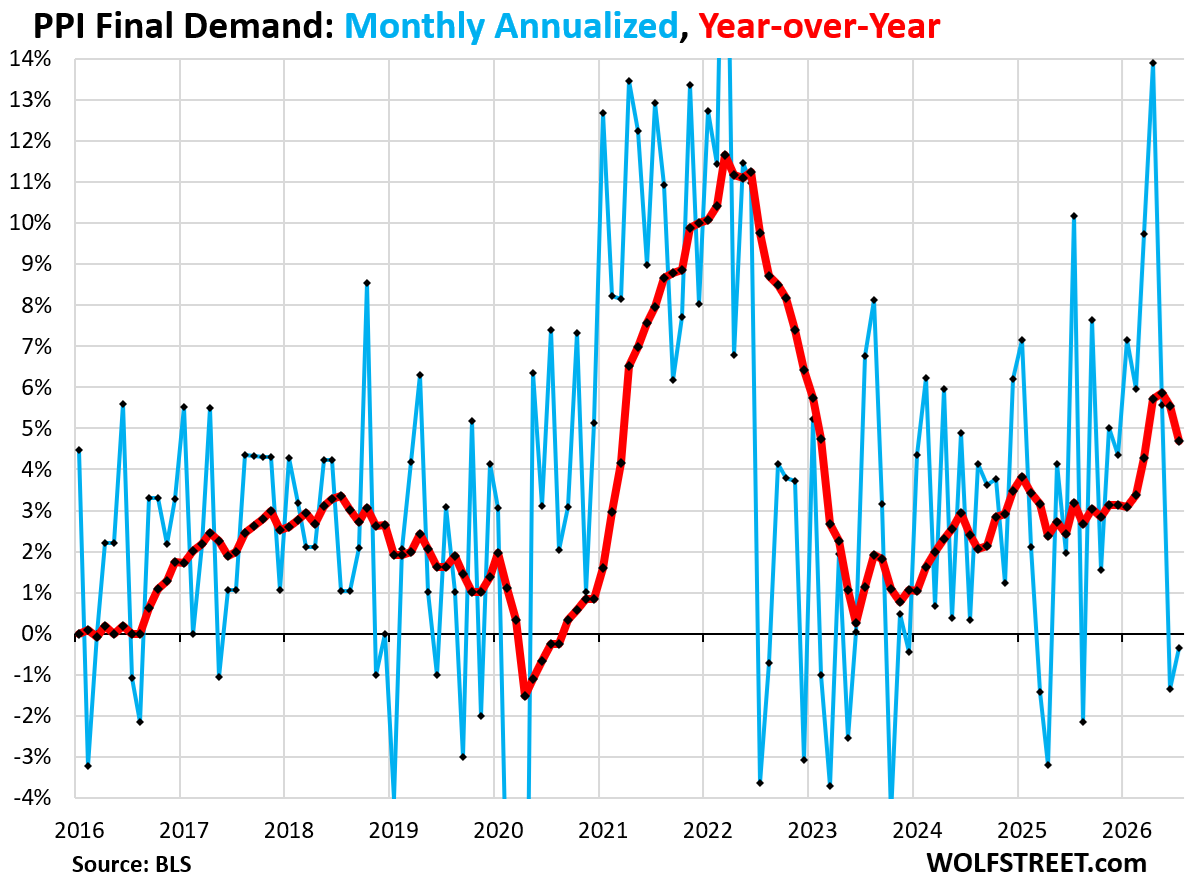
- •The overall PPI for final demand declined 0.03% in July from June, largely due to a 3.1% plunge in energy prices marking the second consecutive monthly drop.
- •The BLS revised June's overall PPI significantly higher from -0.28% to -0.1%, driven by a massive upward revision in the services PPI component.
- •June's services PPI was more than doubled from the initially reported +0.21% to +0.47%, revealing deeper producer-level inflation than first estimated.
- •June's core PPI, excluding food and energy, was revised nearly double from +0.20% to +0.39%, reflecting persistent underlying inflationary pressures.
- •Year-over-year, the overall PPI rose 4.7%, down from the 5.5% to 5.9% highs recorded in the preceding three months but still elevated relative to historical levels.
July PPI Edged Down as Energy Prices Plunged, but June Revisions Reveal Deeper Inflation
The Producer Price Index (PPI) for final demand — a broad measure of inflation in the prices companies pay one another — edged down 0.03% in July from June, equating to an annualized rate of -0.3%. The decline was driven partly by the PPI for energy, which posted its second consecutive monthly decline. Energy prices feed into companies' input costs and ripple across industries, including the services PPI through truck transportation services and other energy-intensive sectors. The PPI is closely watched as an upstream indicator because producer-level price pressures tend to pass through, with a lag, into consumer prices measured by the Consumer Price Index (CPI) and the Fed's preferred Personal Consumption Expenditures (PCE) price index.
However, the Bureau of Labor Statistics (BLS) substantially revised June's figures higher. The overall PPI for June was revised to -0.1% from the originally reported -0.28%, reflecting a massive upward revision in the services PPI component. The BLS routinely revises PPI data in subsequent monthly releases as additional survey responses arrive, and services components — which are surveyed less frequently and rely more on late-arriving data — are particularly prone to meaningful revisions.
Year-over-year, the overall PPI rose 4.7% — still elevated, though below the multi-year highs of 5.5% to 5.9% recorded in the preceding three months. The PPI has been trending higher in a zigzag pattern since its mid-2023 low.
Services PPI: Where the Revisions Bite
The services PPI, which accounts for 68% of the overall PPI final demand, rose 0.20% in July from June. The increase was tempered by a 1.8% month-over-month drop in truck transportation of freight costs, itself a consequence of falling energy prices.
The real inflation story emerged in the revisions. A month ago, the BLS reported that June services PPI had risen 0.21% from May. Today, that figure was more than doubled to +0.47%.
Year-over-year, the services PPI rose 3.9%, a deceleration from the upwardly revised June reading. Services inflation has been climbing in a zigzag pattern since the December 2023 low.
Within the Services PPI, Month-to-Month:
- Transportation & warehousing services PPI plunged 1.8% in July from June, the second consecutive monthly decline, tracking the drop in the energy PPI. This category includes the 1.8% monthly decline in truck transportation of freight and accounts for 4.9% of the overall PPI.
- Trade services inched up 0.1% in July from June, building on a massively upwardly revised 1.4% spike in the prior month (originally reported as +0.4%). The index accounts for 19% of the overall PPI.
- "Other services" rose 0.6% in July from June. This category accounts for 38% of the overall PPI.
Core PPI Also Revised Sharply Higher
Core PPI for final demand — which excludes food and energy components and is dominated by the services PPI — rose 0.24% on a seasonally adjusted basis in July (+3.0% annualized).
June's core PPI was revised massively higher, nearly doubling from the originally reported +0.20% to +0.39% (+4.8% annualized), driven by the substantial upward revision to the services PPI.
Year-over-year, core PPI rose 4.2%. The April-through-July period marked the worst four-month stretch since January–February 2023. Core PPI has been zigzagging higher since its December 2023 low.
Core Goods PPI
The PPI for core goods, which excludes energy and food, rose 0.13% (+1.6% annualized) in June from May on a seasonally adjusted basis, following spikes in April and May.
Year-over-year, core goods PPI rose 4.9%, a deceleration from the upwardly revised June increase. The last three months represent the worst such period since February 2023. The index has been zigzagging higher since March 2024.
Energy and Food PPI
The PPI final demand for energy plunged 3.1% in July from June (not annualized), the second consecutive monthly decline following three months of spikes. Year-over-year, the energy PPI remains up 17.9%.
The PPI final demand for food fell 0.93% in July from June, the second consecutive monthly decline. Year-over-year, the food PPI was unchanged. Food prices remain elevated following the surge from 2021 through 2022, though the pace of further increases from those high levels has moderated over the past two years.
