PCE Inflation Stayed Hot in July as Core Services and Durable Goods Rose
Key Takeaways
- •Core PCE inflation rose 0.25% in July from June and was up 3.35% from a year earlier, unchanged from June’s annual rate.
- •The all-items PCE index increased 3.7% year over year, nearly twice the Federal Reserve’s 2% target.
- •Core services prices rose 0.27% in July and 3.7% from a year earlier, with recurring service costs continuing to drive inflation.
- •Information processing equipment prices increased sharply, rising 1.4% in July and 15.5% year over year, while jewelry and watches also posted strong gains.
- •Food prices edged down in July but were still up 2.4% from a year earlier, and energy prices fell on the month while remaining 15.3% above year-ago levels.
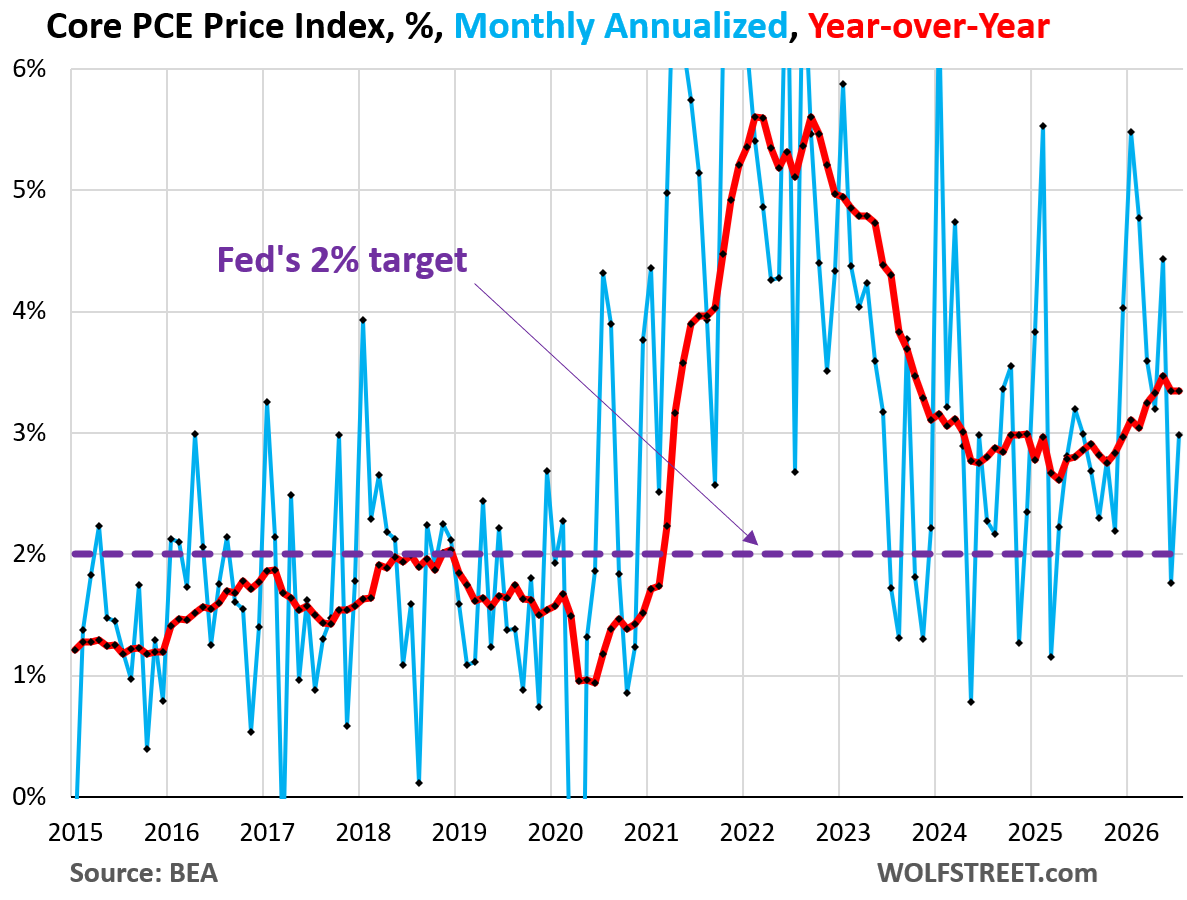
The Fed-favored PCE price index presented a slightly different and more concerning picture of July inflation than the CPI had earlier this month. Energy prices remained 15% above year-ago levels, and food inflation accelerated slightly to 2.4%. But beyond energy and food, the core PCE price index continued to be driven by inflation in core services, where more than 60% of consumer spending goes, as well as by the AI boom, which has begun to exact a direct cost from consumers.
The core PCE price index, which excludes food and energy, rose 0.25% in July from June, equivalent to a 3.0% annualized rate.
Year over year, it rose 3.35%, the same increase as in June. The last four months produced the biggest increases since October 2023.
The Fed uses the core PCE price index as one of its measures for the 2% inflation target, allowing it to look through temporary moves in energy prices. The index has been above the Fed’s 2% target since March 2021 and never came close to that target afterward. It bottomed out at 2.6% in April 2025 and has moved further away from 2% since then.
The all-items PCE price index, the other inflation gauge the Fed uses, rose 0.16% in July from June, equal to a 1.9% annualized rate.
Year over year, the PCE price index rose 3.7%, the same increase as in June. Inflation in the five months from March through July was the worst since March 2023. By this measure, inflation is nearly double the Fed’s 2% target and has been moving away from that target since May 2025.
The core services PCE price index rose 0.27% in July from June, equal to a 3.3% annualized rate.
Year over year, the core services PCE price index rose 3.7%. May, June, and July all fell into this range and marked the worst increases since February 2025.
Core services account for more than 60% of consumer spending. They include rent, healthcare, travel, lodging, transportation services such as airline fares, insurance of all kinds, auto repair and maintenance, subscriptions of all kinds, financial services, and more. Because many of these costs are recurring and hard to avoid or shop around for, they tend to keep showing up in inflation readings even when prices for individual goods categories cool. Companies that believe they can raise prices without losing customers do so, and consumers have little choice but to pay.
The durable goods PCE price index jumped 0.37% in July from June, equal to a 4.6% annualized rate, and rose 3.4% year over year.
A number of goods categories saw price declines from a year earlier, with some easing after last year’s price spikes, while many others posted modest increases. But two categories saw especially sharp recent gains.
Information processing equipment, including computers, tablets, accessories, and software, rose 1.4% month to month, or 18% annualized, and 15.5% year over year. The increase began suddenly in December. Over the past eight months, the PCE index for this category has risen 22%. This is where AI is beginning to exact a direct cost from consumers.
Jewelry and watches rose 2.0% month to month, or 27% annualized, and 14.8% year over year, as the years-long increase in gold prices is gradually being passed on to consumers.
Food prices edged down in July after rising in June. Year over year, the index increased 2.40%, the highest in three months.
Food categories moved in different directions. Egg prices fell further, continuing to unwind the avian-flu profiteering spike. Beef prices appear to have peaked and have begun to edge down. Coffee continues to rise sharply. Sugar and sweets are still moving higher, as are fresh milk and fresh seafood. Poultry and pork declined month to month and were roughly unchanged from a year earlier.
The energy PCE price index fell 1.5% in July from June, the second straight monthly decline after the spike in prior months.
Year over year, the index was still up 15.3%. Within energy, the gasoline index was still 25% above year-ago levels.
This chart shows the price level, not the year-over-year percentage change.
