Technical Scoop: Precious Metals Catch a Bid, Hormuz Deal Hopes Persist, Energy Declines
Key Takeaways
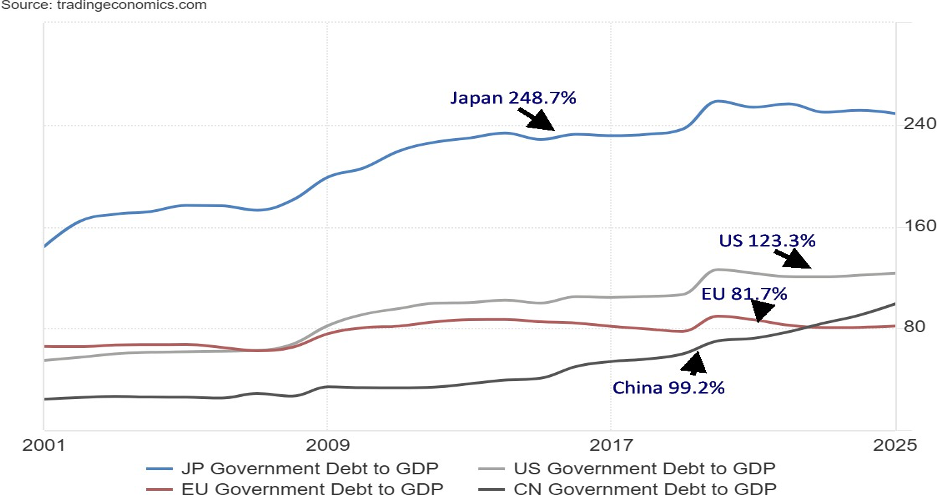
- •Japan carries the highest debt-to-GDP ratio of any nation, and analysts warn that if the 10-year JGB yield exceeds 3%, interest costs could consume roughly 30% of Japan's national budget.
- •The U.S. economy lost 23,000 jobs in July against market expectations of an 80,000 gain, with May and June figures revised downward by a combined 103,000 positions.
- •Canada added 75,100 jobs in July, far exceeding the 15,000 forecast, reducing the unemployment rate to 6.4%, its best level in two years.
- •The S&P 500 and Dow Jones Industrials reached new all-time highs, with the S&P 500 gaining 3.6% on the week, driven by AI infrastructure investment and robust corporate earnings.
- •WTI crude oil fell approximately 9% as the Strait of Hormuz remained effectively closed, with roughly one-fifth of global daily oil consumption normally transiting through the chokepoint.
Japan: The Potential Epicenter of a Sovereign Debt Crisis
Could Japan be the starting point of the next sovereign debt crisis? The country carries enormous debt, faces rising inflation, and is experiencing climbing interest rates after years of ultra-low rates and massive stimulus designed to revive its stagnant economy. Japan's trajectory since its asset bubble burst in the early 1990s — ushering in the so-called "Lost Decades" of deflation and anemic growth — required extraordinary fiscal and monetary support, the costs of which are now compounding as global interest rates reset higher. As the largest foreign holder of U.S. Treasuries, Japan raises concerns that it may be forced to sell those holdings to defend the sinking yen.
In a rare coordinated move, the U.S. Treasury joined the Bank of Japan (BOJ) recently in intervening to support the Japanese yen. A weak yen is not in America's interest, as it makes Japanese exports cheaper. In 2025, the U.S. trade deficit with Japan was $63.9 billion. As of June 2026, the 2026 deficit had already reached $21.7 billion. The U.S. worries this situation undermines its tariffs. A weak yen also makes Japanese imports more expensive — Japan imports roughly 97% of its energy needs (both oil and LNG) and depends on imports for about 60% of its food supply.
Japan is America's largest ally in Asia, but it also poses a financial threat: it holds approximately $1.14 trillion in U.S. Treasury securities, the largest holding of any foreign entity. While that represents only about 3% of the roughly $40 trillion in total outstanding U.S. federal debt, it remains significant. Over the past year, Japan has not materially increased its Treasury holdings. Foreign holdings of U.S. Treasury securities have risen approximately $350 billion over the past year, but the U.S. has added about $3.2 trillion to its national debt in the same period. Japan's share of that increase is negligible, while foreign holdings gains represent only about 11% of the total.
The U.S. needs buyers for its debt, given it runs a budget deficit of 6.5% of GDP. The concern is that holders of U.S. debt could sell to raise funds for domestic needs. If that occurred, U.S. bond prices would fall, yields would rise, and the cost of servicing the massive American debt could reach unmanageable levels. The U.S. dollar would also decline as sellers convert their funds back to their home currencies.
Japan has the highest debt-to-GDP ratio not just in the G7 but in the world. Surprisingly little of that debt is foreign-owned. Japanese Government Bonds (JGBs) are primarily held by the BOJ — which owns roughly half — along with pension funds, Japanese banks, and insurance companies. The massive debt accumulated over decades due to very slow growth and stimulus spending.
After years of low inflation and even deflation, Japanese inflation has accelerated and JGB yields have risen, pushing borrowing costs higher. The BOJ has been forced to raise its key interest rate, though it still lags the broader JGB market. As JGB yields reached record highs, the Japanese yen fell to 40-year lows. Ultra-cheap borrowing rates also fueled the yen carry trade, in which investors borrow yen at low rates, sell yen primarily for U.S. dollars, and invest in higher-yielding U.S. Treasury or equity markets. Rising Japanese bond yields and a strengthening yen both threaten this trade. If Japan were forced to sell U.S. Treasuries, it could trigger a bond crash with contagion effects across global financial markets.
The world experienced a massive debt expansion following the 2008 financial crisis, when central banks intervened heavily to prevent a complete collapse. The EU/Greek debt crisis that began in 2009 and persisted through much of the following decade added to the growth in debt. The 2020 pandemic delivered the final surge. Since then, central bank balance sheets have declined, though the U.S. Federal Reserve's balance sheet has begun growing again. The BOJ's balance sheet stood at 123,000 billion yen in 2008; today it sits at 639,551 billion yen.
During the 1970s and 1980s, the U.S. dollar was strong and the yen weak — one dollar could buy roughly 250 yen in the early 1980s. Over subsequent decades the yen strengthened, and by 2010 one dollar bought only about 75–80 yen. Since then the yen has weakened. Today, one dollar buys roughly 157 yen, down from 163 yen just two weeks ago following BOJ and U.S. Treasury intervention. Notably, the U.S. did not sell dollars to buy yen; instead it used euros, so as not to weaken the dollar — a move that surprised the ECB. Total BOJ intervention was approximately $52.8 billion, while U.S. intervention was between $5 billion and $10 billion.
Japanese inflation was negligible for years — near zero and occasionally negative. The pandemic stimulus unleashed a significant inflation wave by 2022, driven by massive debt expansion, ultra-low rates (Japan's rates went negative, as did the eurozone's), and supply constraints. Japan's latest inflation rate is 1.7%, compared to 3.5% in the U.S. and 2.9% in the EU. Central banks have been hiking rates since 2022. While the U.S. and EU have since lowered rates as inflation eased, Japan continues to raise. The current BOJ policy rate is 1%, the Fed rate is 3.75%, and the ECB rate is 2.4%. Only the ECB currently has a positive real yield.
The Japanese 10-year JGB has surged to levels not seen since 1996. In September 2019 it bottomed at negative 0.23%. Today it sits at 2.81% and rising. The Japanese 30-year bond recently hit 3.90%, near a record. The spread between the Japanese and U.S. 10-year yields is approximately 187 basis points, up from just 64 bp at the August 2020 nadir. Higher borrowing costs are having consequences: U.S. borrowing costs are approaching $1.2 trillion annually, while Japan's are around $68 billion but rising rapidly and projected to more than double in a few years. Some analysts say that if the Japanese 10-year exceeds 3%, Japan could struggle to cover interest costs, which could consume roughly 30% of the national budget — social security is already the single largest item in Japan's fiscal budget, and the squeeze between rising debt-service costs and growing entitlement obligations leaves little room for fiscal maneuver. For comparison, U.S. interest payments now represent about 15% of the budget and have exceeded the U.S. defense budget, ranking third behind Social Security and Medicare/Medicaid.
One often overlooked characteristic of Japan is its dual challenge of a large elderly population and a declining population. Japan's elderly population is currently 29.3% of the total and is projected to reach 34.8% by 2040. For comparison, across most G7 countries the elderly share ranges from 19% (U.K. and Canada) to 25% (Italy), with the U.S. lowest at roughly 17%. Japan's population peaked around 2010 at approximately 128.6 million and has since declined to 123.2 million (2025). The combination of a falling population and a rising elderly share could be, as the author notes, a ticking time bomb for Japan's government finances. A shrinking working-age population translates into a shrinking tax base precisely as pension and healthcare obligations expand — a structural mismatch that no amount of monetary stimulus can resolve. Of the G7 nations, if a financial crisis were to begin, it could start in Japan.
U.S. July Job Numbers: A Surprise to the Downside
The U.S. Bureau of Labor Statistics (www.bls.gov) reported that the U.S. economy lost 23,000 jobs in July, against market expectations of an 80,000 gain. May and June figures were revised downward by a combined 103,000 jobs. The unemployment rate (U3) was 4.1%, down from June's 4.2% — but this decline was caused solely by a 264,000 drop in the civilian labour force. The labour force participation rate was 61.4% versus 61.5%, and the employment-to-population ratio fell to 58.9% from 59%. The U6 unemployment rate was 7.9%, unchanged from June.
The number of officially unemployed (U3) fell by 178,000, even as the population level rose by 116,000 — more people, fewer working, and fewer unemployed. Government, leisure, and hospitality workers led the decline. Full-time employment fell by 106,000, while part-time employment rose by 138,000. The number of multiple job holders rose by 39,000. Those unemployed 27 weeks or longer fell by 64,000, while average weeks unemployed declined to 24.9 from 25.5 and median weeks unemployed rose to 9.5 from 8.8.
The shift from full-time to part-time work, combined with the rise in multiple job holders, is a pattern historically associated with employers trimming commitments ahead of a broader slowdown — workers who lose full-time positions often take part-time roles or second jobs to make up lost income. Evidence suggests ICE deportations are causing companies to lose workers, in some cases threatening their ability to continue operations. Anti-immigration policies have slowed the growth of the potential labour pool, which matters because workforce growth in recent years has been substantially driven by foreign-born workers. The labour market has weakened, though not drastically, and wage growth is also slowing, suggesting diminished worker bargaining power. Market reaction saw gold soar and stocks creep higher, with the U.S. 10-year Treasury yield ticking marginally lower. This puts the Fed in a bind: inflation pressures suggest rate increases, while a slowing economy argues for cuts. Fed Chair Kevin Warsh has made dovish statements, but three FOMC members voted for higher rates at the last meeting. The September FOMC meeting will be pivotal, and July CPI/PPI data due this week will provide further direction.
Canada July Job Numbers: A Positive Surprise
Despite trade uncertainty, Canada added 75,100 jobs in July, well above the 15,000 forecast. The unemployment rate fell to 6.4% from 6.5% — its best level in two years. The R8 unemployment rate (www.statcan.gc.ca), the highest measure reported by Statistics Canada, jumped to 9.3% from 8.5%. Full-time employment rose by 38,600 and part-time by 36,600, with gains in wholesale and retail, finance, and insurance. Public sector employment fell. Ontario led the gains. Statistics Canada is expecting 3.4% GDP growth in Q2. Canada has added 196,000 jobs over the past year, compared to 316,000 in the U.S. on a population base eight times larger. It is worth noting that Canada has been among the fastest-growing developed economies by population, driven by record immigration levels — which means headline job creation must be assessed against a rapidly expanding labour force. The Canadian dollar and the TSX Composite both rose. However, Trump's threats of 50% tariffs later in August continue to loom, and trade negotiations are reportedly not going well due to U.S. demands Canada cannot accept.
Stock Markets: The Bull That Refuses to Die
AI stocks and the MAG7 led another rally, producing new all-time highs for the S&P 500 and the Dow Jones Industrials (DJI). The NYSE Composite, the Dow Jones Composite (DJC), the S&P 500 Equal Weight Index, the S&P 100 (OEX), the S&P 400 (Mid), the S&P 600 (Small), the Russell 1000, 2000, and 3000, and the NY FAANG Index (barely) also reached new highs. While the breadth of new highs across multiple indices is notable, the outsized influence of a handful of mega-cap technology stocks on index-level returns remains a defining characteristic of this rally.
Robust corporate earnings, AI infrastructure investment, and resilient economic indicators are all pushing markets higher. An accommodative Fed is also helping: both M1 and M2 money supply are rising, and the Fed's balance sheet is growing again after a period of contraction. On the week, the S&P 500 rose 3.6%, the DJI gained 3.0%, the Dow Jones Transportations (DJT) rose 2.2%, and the NASDAQ was up 5.1%. The S&P 400 (Mid) gained 3.4%, the S&P 600 (Small) added 2.4%, and the NY FANG Index surged 8.5%. Bitcoin gained 3.2% but remains down almost 50% from its all-time high.
In Europe, the London FTSE rose 0.3%, EuroNext made all-time highs (up 2.3%), the Paris CAC 40 made all-time highs (up 2.4%), and the German DAX set new records (up 2.7%). In Asia, China's Shanghai Index (SSEC) rose 2.8%, the Tokyo Nikkei Dow (TKN) gained 1.9%, Hong Kong's Hang Seng (HSI) fell 0.8%, and India's Nifty Fifty rose 0.8%.
Among the MAG7, all were up except Google, which declined 0.9%. Nvidia led with an 11.6% gain. Other notable double-digit movers included Snowflake (up 12.7% to all-time highs), ServiceNow (NOW, up 12.3%), CrowdStrike (CRWD, up 12.3%), and SpaceX (SPCX, up 22.8%).
In Canada, the TSX Composite gained 3.3% to new all-time highs, and the TSX Venture Exchange (CDNX) surged 10.1%. Materials led: Golds (TGD) up 20.4%, Metals (TGM) up 14.9%, and Materials (TMT) up 16.9%. Energy (TEN) was the biggest loser, down 6.3%.
The author notes that an argument can be made for an S&P 500 target of 8,000, but a break below 7,300 could prove significant to the downside. The current bull market has run 17 years (2009–2026) with interruptions in 2015/2016, 2018, 2020, and 2022, compared to the 18-year 1982–2000 bull that ended with the dot-com bust.
Bonds: Yields Ease Amid Weak Jobs Data
Treasury yields eased slightly on the weaker-than-expected July job numbers. The U.S. 10-year Treasury note yield fell to 4.65% from 4.74%. Canada's 10-year government bond (CGB) eased to 3.64% from 3.67%, despite the strong Canadian jobs report. The decline in U.S. employment data has raised concerns about the American labour market and dimmed the chances of a Fed rate hike at the September 15–16 FOMC meeting. However, the consensus still places some odds on a September or October rate hike, though those odds have fallen.
Fed Chair Warsh's move to end forward guidance — a practice he long criticized and one that has been a cornerstone of Fed communication strategy since the Bernanke era — may introduce more bond market volatility, as investors lose the signposts they have relied on to position around policy shifts. The Fed's preferred inflation measure, Personal Consumption Expenditures (PCE), was last at 3.70% year-over-year, well above the 2% target. The current Fed rate is 3.75%. The July PCE figure is due later in August.
Gold and Silver: A Notable Rally, but Confirmation Needed
Gold rose 7.3% on the week and is again positive year-to-date. Silver gained 9.9% but remains negative for 2026. Gold stocks were particularly strong: the Gold Bugs Index (HUI) jumped 21.9% and the TSX Gold Index (TGD) gained 20.4%. Both are now positive on the year, with the HUI up 7.4% and the TGD up 8.3%. Platinum rose 5.9%, palladium gained 8%, and copper made marginal new all-time highs with a 1% gain. The gold/silver ratio improved to 68.37, well down from its 2020 pandemic high of 126.
Sustained central bank gold purchasing — particularly from emerging-market central banks diversifying reserves away from the U.S. dollar — has provided a structural demand floor under the gold market in recent years, adding a fundamental dimension to the technical breakout underway.
While the breakout appears constructive, the author cautions that confirmation of a final low requires a breakout above $4,400, with a close above $5,200 needed to begin considering a run toward new highs above $5,600. The five-wave descent labeled ABCDE could represent only an A wave of a higher degree, with the current rally potentially a B-wave correction rather than the start of a sustained move to new highs. Silver faces similar technical thresholds: a breakout requires a move above $70, and new highs would require regaining $106. The current 7.8-year cycle is only at its halfway point, roughly four years from the important 2022 low.
Oil and Gas: Strait of Hormuz Remains Closed
The situation between the U.S. and Iran over the Strait of Hormuz remains confused, with the two sides issuing contradictory statements. Trump has indicated a deal is at hand, while Iran has laid out demands it says have not been met. The strait remains effectively closed. The Strait of Hormuz is one of the world's most critical energy chokepoints, through which roughly one-fifth of global daily oil consumption normally transits — making any prolonged disruption a direct threat to global energy supply chains. Iran and Oman have been working on a deal for limited access, but the proposed Iranian bill would effectively ban the U.S., Israel, and any hostile country from transiting — which would include most Gulf-region nations. Iran backs its position with drones and missiles capable of striking shipping.
The oil market has reacted to hopes of a deal by selling off. WTI crude fell approximately 9% on the week, and Brent crude declined 6.7%. Natural gas at the EU Dutch Hub fell 7.8%, while North American NG fell 1.1%. Energy stocks declined: the ARCA Oil & Gas Index (XOI) dropped 5.2% and the TSX Energy Index (TEN) fell 6.3%. Commercial oil inventories remain painfully low, particularly diesel, across the U.S. and EU, though Asia is in better shape.
Ukraine's ongoing strikes on Russian oil facilities continue to exert upward pressure on global oil prices. The Russia/Ukraine and Gulf conflicts are converging, given Ukraine's recent assault on an Iranian cargo ship allegedly carrying arms to Russia, and Iran's ongoing supply of drones and military equipment to Russia.
Technically, the author views oil positively. The ABC decline from the March/April 2026 high may have bottomed at the July spike low of $67, followed by a V-bottom reversal. If WTI can hold above $75 and then retake $90, a low could be confirmed, though a full breakout requires a move above $105. Natural gas may be forming a double bottom but must hold above $2.50, with a takeout point at $3.40. Seasonally, energy is in a weak period, with the next seasonally strong period still several months away.
Reference to the Enriched Capital Conservative Growth Strategy and its investments, celebrating an 8.42-year history of 204% growth (annual 14.17%) and alpha exceeding the index, is added by Margaret Samuel, President, CEO and Portfolio Manager of Enriched Investing Incorporated. This information should not be construed as an offer, or a solicitation of an offer or sale of any security. Past performance does not guarantee future returns.
"But if arming Iran to support Israel was insane, the flip side of the policy, in the long run at least, was truly demented: Weinberger and Shultz favored defending Saudi Arabia and the enormous U.S. oil interests there by secretly bolstering the brutal Iraqi dictator Saddam Hussein. As a result of their efforts, billions of dollars in aid and weapons were funneled to Saddam's regime."
— Craig Unger, American journalist and writer, author of House of Bush, House of Saud (2004) and House of Trump, House of Putin: The Untold Story of Donald Trump and the Russian Mafia (2018); b. 1949
"The fossil fuel industry commands outsize sway over U.S. politics, markets, and democracy. I knew these companies were formidable, but when I served on the National Commission on the BP Deepwater Horizon Oil Spill and Offshore Drilling, I got a close-up view of how the industry disregards government safeguards."
— Frances Beinecke, American activist, chair of the Natural Resources Defense Council (2006–2015); b. 1949
"The Bush administration and Congressional Republicans have failed to bring up comprehensive energy reform or any piece of legislation for that matter that would lower gas prices, opting instead to give massive subsidies to the oil and gas industry."
— Rosa DeLauro, American politician, U.S. Representative for Connecticut's 3rd congressional district since 1991, chair of the House Appropriations Committee for the 117th Congress; b. 1943
Disclaimer: David Chapman is not a registered advisory service and is not an exempt market dealer (EMD) nor a licensed financial advisor. The information in this newsletter is intended only for informational and educational purposes and should not be construed as an offer, solicitation of an offer, or sale of any security. The reader assumes all risk when trading in securities. David Chapman advises consulting a licensed professional financial advisor before proceeding with any trade or idea. Performance is not guaranteed, values change frequently, and past performance may not be repeated.
