Injective Extends Losses as Futures Open Interest Drops; $7.19 Support in Focus
Key Takeaways
- •INJ traded around $7.42 on Thursday after losing 5.7% during Wednesday's session, keeping the token below $7.50 amid limited buying conviction.
- •INJ futures Open Interest declined 4% over 24 hours to $140.77 million, extending a steady reduction since mid-October as traders cut exposure.
- •The taker buy-to-sell ratio stood at 0.96, with sell orders accounting for 51.1% of taker activity, indicating aggressive sellers currently outweigh buyers in the futures market.
- •Technically, INJ trades below its 50-day EMA near $7.55 but remains above ascending trendline support at $7.19 and the 200-day EMA near $6.27, while a MACD bearish crossover and an RSI around 44 point to weakening momentum.
- •A sustained break below the $7.19 trendline would put supports at $6.71 and $6.27 in focus, while a decisive daily close above $8.35 could open a recovery toward $9.41.
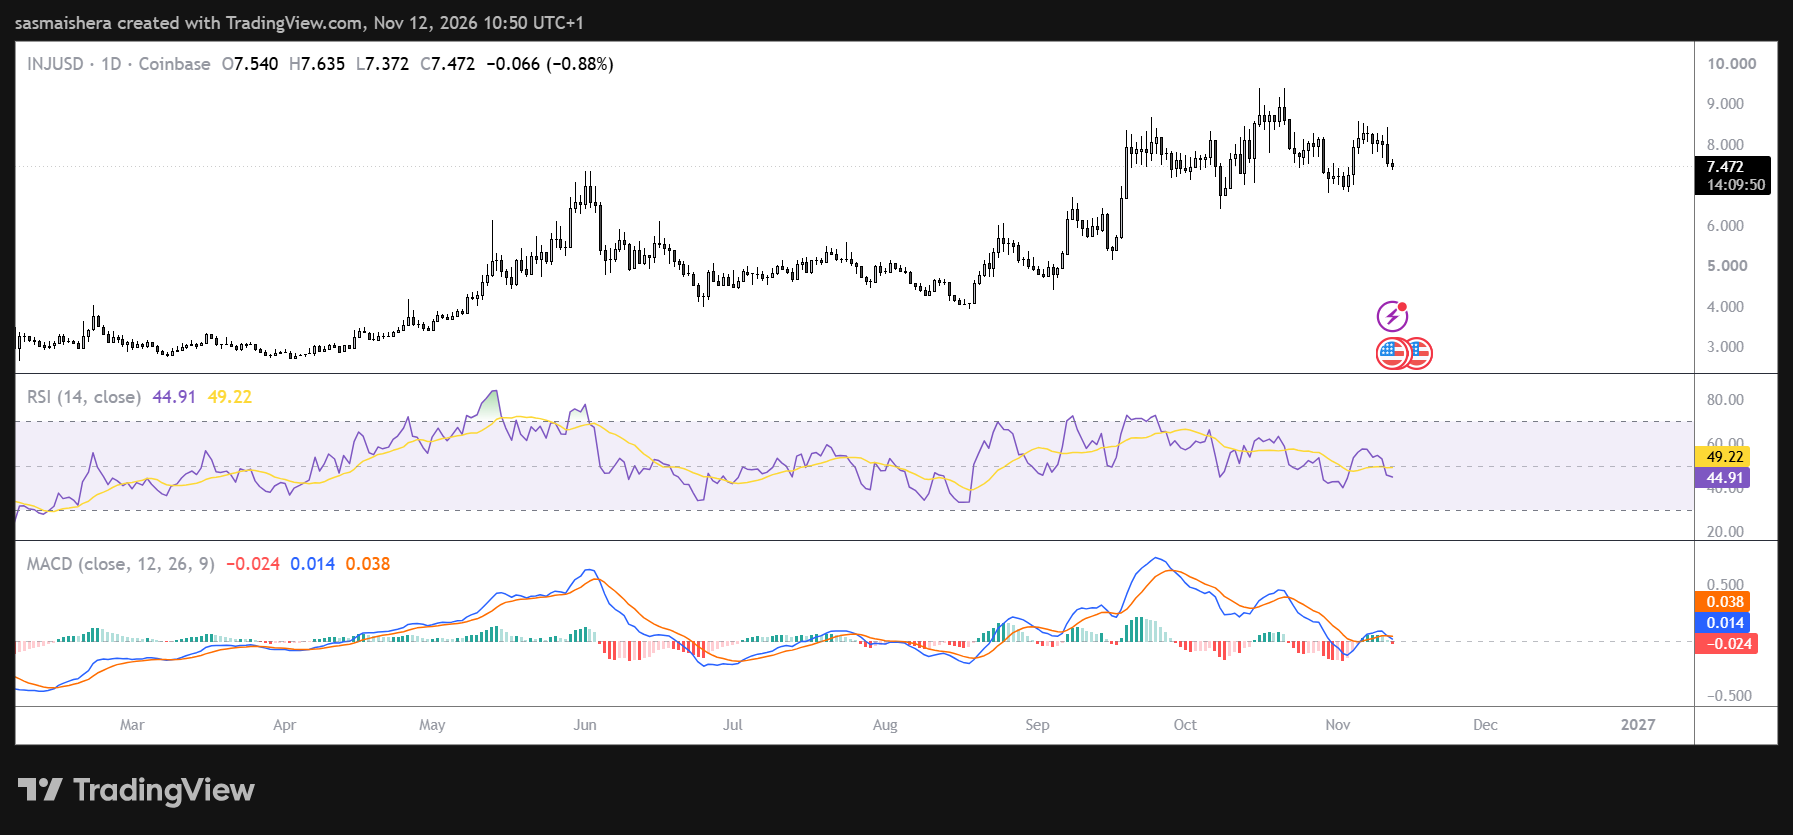
Injective (INJ) remained under pressure on Thursday, trading below $7.50 as declining derivatives activity and renewed selling weighed on the token's near-term recovery prospects. The cryptocurrency changed hands around $7.42 after losing 5.7% during Wednesday's session, with traders showing little conviction in a sustained rebound. Data from CoinGlass shows a steady reduction in futures Open Interest since mid-October, while market sell orders continue to outweigh aggressive buying activity. INJ is the native asset of Injective, a layer-1 blockchain focused on decentralized finance, a setting in which derivatives positioning is closely watched as a read on trader conviction.
Futures Open Interest Falls as Traders Reduce Exposure
Investor participation in Injective's derivatives market has weakened considerably over the past several weeks. According to CoinGlass, INJ futures Open Interest declined 4% over the last 24 hours and now stands at $140.77 million. Open Interest measures the total notional value of outstanding futures contracts and is often used to gauge market participation and trend strength. A sustained decline of this kind typically indicates that traders are reducing their positions, potentially reflecting weaker speculative interest or uncertainty about the market's direction. That is one reason simultaneous slides in price and Open Interest tend to be read as a retreat in overall engagement rather than the arrival of fresh directional bets.
Sellers also retain a slight advantage in Injective's futures market. The INJ taker buy-to-sell ratio stands at 0.96, meaning aggressive sell orders are exceeding aggressive buy orders, and sell orders account for 51.1% of taker activity. A ratio below 1 generally suggests that traders executing market orders are more willing to sell into existing bids than to buy from available offers. Together, the sell-heavy taker flow and falling Open Interest point to a softer tone across Injective's derivatives market.
Technical Outlook: INJ Tests Key $7.19 Trendline Support
Injective's daily chart presents a mixed technical picture, with the cryptocurrency trading between an important moving average and a rising support trendline. At the time of writing on Thursday, INJ traded around $7.42, slightly below its 50-day Exponential Moving Average (EMA) near $7.55, a widely used short-term trend gauge. The inability to reclaim that moving average suggests that buyers have yet to regain control of the near-term trend.
However, the token continues to trade above an ascending support trendline around $7.19, and the 200-day EMA, positioned near $6.27, also remains below the current market price. Holding above this longer-term moving average suggests that the broader technical structure has not yet deteriorated as significantly as recent price action might otherwise imply.
Nevertheless, momentum indicators are beginning to weaken. The Moving Average Convergence Divergence (MACD) has crossed below its signal line, indicating that bullish momentum is fading, while the Relative Strength Index (RSI) stands around 44, slightly below the neutral threshold of 50. This points to growing seller influence, although the market has not yet entered oversold territory.
Key Support and Resistance Levels
The ascending trendline near $7.19 represents Injective's first important downside support. A sustained move below this level would weaken the current technical structure and suggest that sellers are gaining greater control. If INJ breaks decisively below the trendline, the next significant support stands at $6.71, and a failure to defend that level would expose another key support region around $6.27.
Despite the recent weakness, Injective could attempt another recovery if buyers successfully defend the $7.19 support trendline. The first obstacle stands at the 50-day EMA around $7.55; a sustained recovery above this level would suggest that buying momentum is improving and could encourage traders to target higher resistance.
The next major barrier stands at $8.35, a horizontal resistance level that limited Injective's gains during the previous week. A decisive daily close above $8.35 would strengthen the bullish outlook and could open the door for a recovery toward $9.41. Alongside those chart levels, shifts in futures Open Interest and the taker buy-to-sell ratio offer complementary checkpoints, since both are used to gauge participation and trend strength in Injective's market.
This article is based on reporting originally published by CoinJournal.

