Inflation-Adjusted Wages Through July: Real Earnings Measured Against CPI
Key Takeaways
- •The article centers on whether wage growth is keeping up with consumer price inflation.
- •Menzie Chinn of the University of Wisconsin–Madison says inflation concerns depend on how fast wages are rising relative to prices.
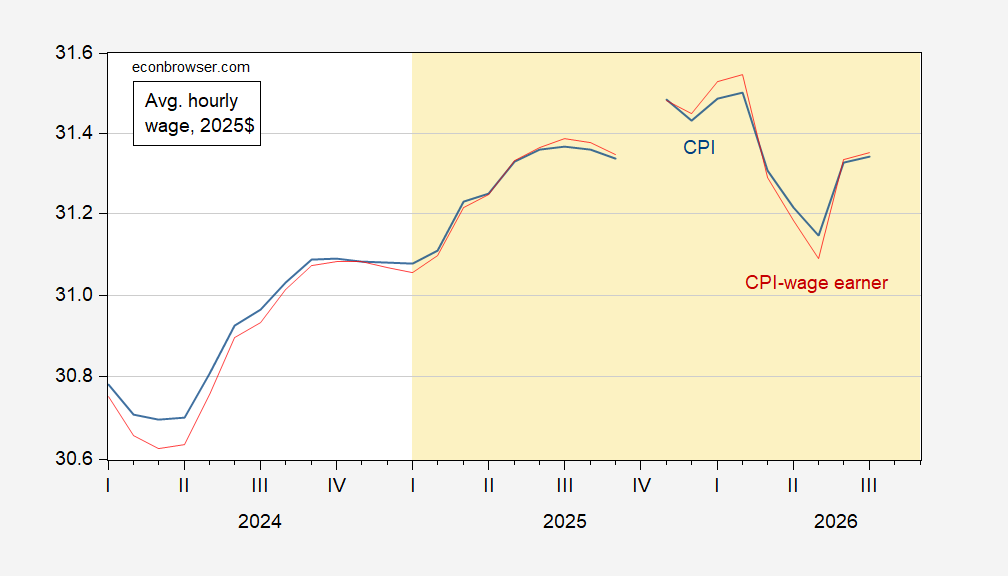
- •The chart compares average hourly wages in 2025 dollars using CPI-U and CPI-W data from the Bureau of Labor Statistics.
- •CPI-U covers about 93% of the U.S. population, while CPI-W covers about 29% and is used for Social Security cost-of-living adjustments.
- •The data in the chart run through July 2026 and measure wages only, not total compensation.
Writing at the Milwaukee Courier, Natalie Yahr for Wisconsin Watch highlighted a key perspective on how Americans experience inflation:
"Concern about prices rising is not just prices rising, but it's against the backdrop of how fast wages are rising. How many people are keeping up, and what components of the population are keeping up?" Chinn said.
The remark, from economist Menzie Chinn of the University of Wisconsin–Madison, underscores a central question in assessing living standards: whether nominal wage growth is outpacing or falling behind consumer price inflation. The comparison matters not only for household budgets but also as a metric tracked by policymakers at the Federal Reserve, who monitor real wage trends as one signal of labor market tightness and inflationary pressure.
To illustrate this dynamic, the article presents a chart tracking average hourly wages adjusted to 2025 dollars using two different consumer price indices published by the U.S. Bureau of Labor Statistics (BLS): the CPI for All Urban Consumers (CPI-U), which covers approximately 93% of the U.S. population, and the CPI for Urban Wage Earners and Clerical Workers (CPI-W), which covers about 29% of the population and is the index used for Social Security cost-of-living adjustments. The two indices weight spending categories differently, which means they can diverge during periods when certain costs—such as food, energy, or housing—rise disproportionately.
Figure 1: Average hourly wage in 2025$ — using CPI-all urban (blue) and using CPI for wage earners and clerical workers (red). Source: BLS and author's calculations.
Real, or inflation-adjusted, wages are calculated by deflating nominal hourly earnings by a price index, yielding a measure of purchasing power over time. When prices rise faster than wages, real wages decline; when wages rise faster, real wages increase. The BLS publishes these figures monthly as part of its Employment Situation report and the Consumer Price Index series. It is worth noting that average hourly earnings capture only wages—not benefits, bonuses, or other compensation—and are drawn from the BLS Current Employment Statistics survey of private nonfarm payrolls.
The data shown in the chart cover average hourly earnings through July 2026.
Source: Milwaukee Courier / Wisconsin Watch; BLS and author's calculations via Econbrowser.
