US Industrial Production Rises 0.2% in June, Missing Consensus Forecast
Key Takeaways
- •U.S. industrial production rose 0.2% month over month in June, below the Bloomberg consensus forecast of a 0.3% increase.
- •Manufacturing output met expectations, and the previous month's figure was revised upward, illustrating that monthly readings shift as more complete source data arrive.
- •Output measures continue to grow faster than employment, a sustained divergence that mechanically raises output per worker and is closely monitored by economists.
- •The Atlanta Fed's GDPNow model currently projects 4% quarter-over-quarter annualized GDP growth, while core GDP — final sales to private domestic purchasers — is tracking at 2.6% versus 3.9% in Q2 (preliminary).
- •Final sales to private domestic purchasers excludes inventories, government spending, and net trade, so the 2.6% tracking figure points to cooler underlying private momentum than the headline nowcast alone suggests.
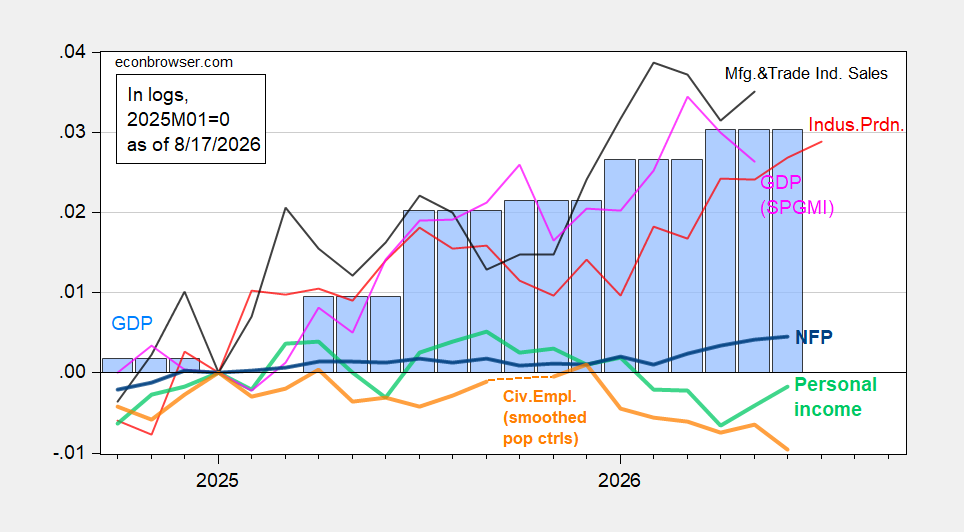
Industrial production rose 0.2% month over month in June, falling short of the Bloomberg consensus forecast of a 0.3% increase, according to the latest business cycle indicators from Econbrowser. The index, published by the Federal Reserve as part of its monthly G.17 release, tracks real output from the nation's factories, mines, and utilities and is among the most widely followed coincident indicators of the manufacturing cycle. Manufacturing output came in line with expectations, while the previous month's figure was revised upward — a reminder that these monthly readings are subject to revision as more complete source data become available. The data continue to show output measures outpacing employment, a divergence economists monitor closely because when output grows faster than employment over sustained periods, output per worker mechanically rises.
Figure 1: NFP employment (bold blue), civilian employment with smoothed population controls (bold orange), industrial production (red), personal income excluding current transfers in Ch.2017$ (bold light green), manufacturing and trade sales in Ch.2017$ (black), and monthly GDP in Ch.2017$ (pink), GDP (blue bars), GDPNow nowcast of 7/10 (light blue box), all log normalized to 2025M01=0. Source: BLS via FRED, BLS, Federal Reserve, BEA 2026Q1 advance release, S&P Global Market Insights (formerly Macroeconomic Advisers, IHS Markit) (7/1/2026 release), and author's calculations.
Figure 2: Civilian employment adjusted to the NFP concept with smoothed population controls, using experimental controls for 2025 (bold orange), manufacturing production (red), ADP private nonfarm payroll employment (light green), real retail sales, CPI deflated (black), freight services indexes (brown), and coincident index in Ch.2017$ (pink), GDO (blue bars), all log normalized to 2025M01=0. Source: BLS, ADP via FRED, Philadelphia Fed, Bureau of Transportation Statistics, Federal Reserve via FRED, BEA 2026Q1 third release, and author's calculations.
On the growth-tracking front, the Atlanta Fed's GDPNow model is currently nowcasting 4% quarter-over-quarter annualized growth (2.3% for GS), but "core GDP" — final sales to private domestic purchasers — is tracking much slower growth at 2.6% q/q AR, compared with 3.9% in Q2 (preliminary). GDPNow is a model-based estimate that the Atlanta Fed updates as each month's incoming data are released, so its projection typically shifts within a quarter as new figures arrive. Final sales to private domestic purchasers strips out inventories, government spending, and net trade to isolate underlying private demand, which is why the 2.6% tracking figure points to cooler underlying momentum than the headline nowcast alone suggests. Subsequent monthly industrial production releases and further GDPNow updates will show whether the gap between headline and core growth measures persists.
Figure 3: Final sales to private domestic purchasers (blue), GDPNow implied (light blue square), and 2023-24 stochastic trend (gray), all in bn.Ch.2017$ SAAR. Source: BEA, Atlanta Fed, and author's calculations.

