Business Cycle Indicators: Industrial Production Beats Consensus as Real Retail Sales Stay Flat
Key Takeaways
- •Industrial production came in ahead of consensus expectations in the latest monthly data, while manufacturing output matched forecasts.
- •Nominal retail sales beat estimates, but inflation-adjusted sales were roughly flat, and the ex-gasoline measure declined when deflated by core CPI.
- •The indicators reviewed are the coincident measures tracked by the NBER Business Cycle Dating Committee, the academic body that officially dates US recessions and expansions.
- •The divergence between nominal and real retail sales illustrates that a spending beat can reflect higher prices rather than a greater volume of goods changing hands.
- •Retail sales figures are Census advance estimates, and like monthly production and GDP indexes, they will be revised in later releases, leaving the initial picture subject to change.
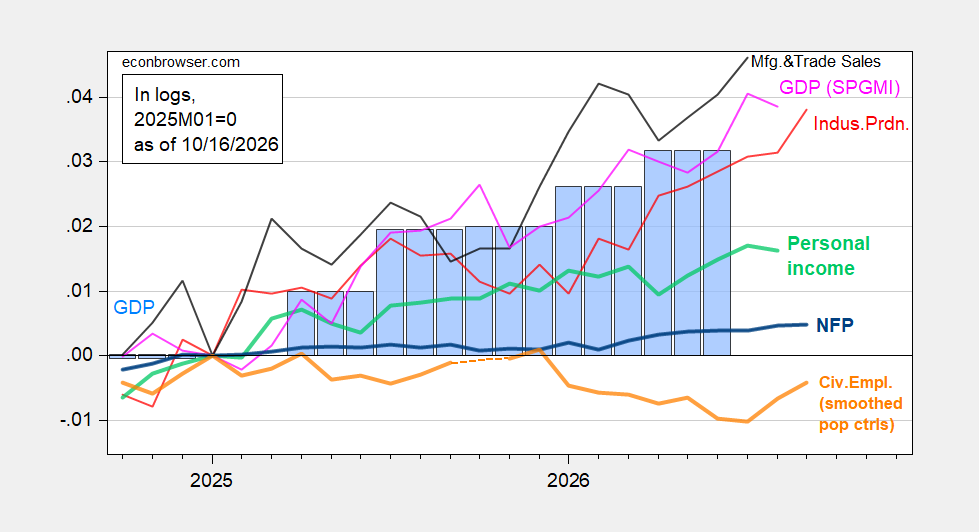
Econbrowser's latest review of US business cycle indicators shows industrial production coming in ahead of consensus expectations, with manufacturing output matching forecasts. Nominal retail sales also topped estimates, but once adjusted for consumer price inflation, sales were close to flat, and sales excluding gasoline stations declined in real terms when deflated by core CPI. The data set covers monthly GDP for August alongside the newest manufacturing production and retail sales releases.
The post tracks the monthly series closely watched by the National Bureau of Economic Research's Business Cycle Dating Committee (BCDC), the academic body that officially dates US recessions and expansions. That framework relies on coincident measures of activity — indicators that move with the overall economy rather than anticipating turning points — including nonfarm payroll employment, civilian employment, real personal income excluding transfers, industrial production, and real manufacturing and trade sales.
Figure 1 plots these benchmark aggregates: nonfarm payroll (NFP) employment (bold blue), civilian employment with smoothed population controls (bold orange), industrial production (red), personal income excluding current transfers in chained 2017 dollars (bold light green), manufacturing and trade sales in chained 2017 dollars (black), and monthly GDP in chained 2017 dollars (pink), with GDP shown as blue bars. All series are expressed in logs and normalized to 2025M01=0. Sources: BLS via FRED, BLS, the Federal Reserve, the BEA's 2026Q2 third estimate, and S&P Global Market Insights' monthly GDP index — formerly produced by Macroeconomic Advisers and IHS Markit — from the 9/2/2026 release, together with the author's calculations.
Figure 2 broadens the dashboard: civilian employment adjusted to the NFP concept using smoothed population controls, including experimental controls for 2025 (bold orange), manufacturing production (red), ADP private nonfarm payroll employment (light green), CPI-deflated real retail sales (black), freight services indexes (brown), and the coincident index in chained 2017 dollars (pink), with gross domestic output (GDO, the average of GDP and gross domestic income) shown as blue bars. All series are again log-normalized to 2025M01=0. Sources include BLS, ADP via FRED, the Philadelphia Fed's state coincident indexes and early benchmark revisions data, the Bureau of Transportation Statistics, the Federal Reserve via FRED, and the BEA's 2026Q2 third estimate.
On the consumer side, Figure 3 sets retail sales deflated by headline CPI (blue) against sales excluding gasoline stations deflated by core CPI (red), both in logs and indexed to 2026M02=0, drawing on Census and BLS data via FRED and the author's calculations. The chart underscores the post's central observation: while headline nominal spending beat expectations, inflation-adjusted retail sales were essentially flat, and the ex-gasoline measure actually fell in real terms. The nominal-versus-real gap illustrates why economists deflate sales by consumer price indexes: the adjustment separates growth in the dollar value of spending from growth in the volume of goods sold, so a nominal beat can reflect higher prices rather than more goods changing hands.
For background, industrial production is published monthly by the Federal Reserve Board, retail sales come from the Census Bureau's advance estimates with real measures derived using BLS price indexes, and ADP's employment report offers a private-payroll gauge. Advance estimates are the Census Bureau's first reading of a given month and are revised in later releases, and monthly production and GDP indexes are updated in the same way, so future prints of these series will show how much of the initial picture holds. Economists monitor these high-frequency series to gauge where the economy stands in the business cycle.
The full analysis, including all charts, is available at Econbrowser: Business Cycle Indicators: Industrial Production Up, Retail Sales Flattish.

