Import Prices Are Rising Rapidly Despite Dollar Strength
Key Takeaways
- •Import prices excluding petroleum increased 4.5% year over year, the largest gain since 2022.
- •Capital goods were among the fastest-rising import categories, especially computers and semiconductors.
- •The dollar appreciated at an annualized 5.2% over the three months ending in July, but import prices still rose more than expected.
- •The tariff changes announced on April 2, 2025, provide the backdrop for the post-April import-price pattern.
- •Economists say the pass-through from higher import prices to CPI and PCE inflation remains muted because many imports are capital goods and industrial inputs.
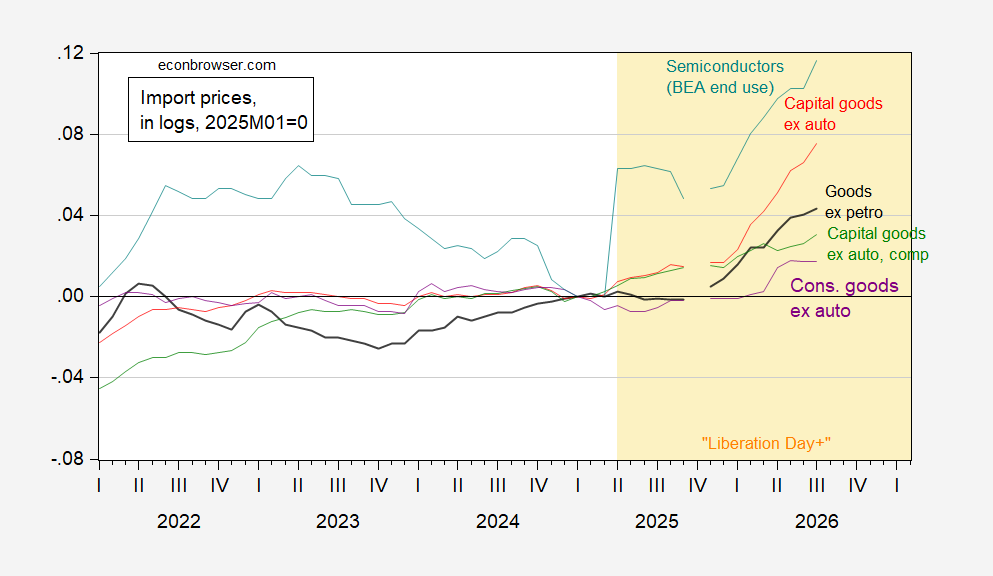
Not just for computers, peripherals, and semiconductors — import prices are running hot even as the dollar has appreciated. From Marketplace, with Justin Ho, today:
Without energy costs, import prices rose 4.5% from the same time a year ago. That is the largest year-over-year increase since 2022. The most significant imports getting more expensive are capital goods.
“Particularly capital goods that are computers and semiconductors,” said Sarah House, senior economist at Wells Fargo.
It is not just computers and related equipment, however.
Figure 1: Import price for all goods excluding petroleum (black), capital goods ex-auto (red), capital goods ex-auto, computers, semiconductors (green), consumer goods ex-auto (purple), semiconductors, BEA end use (teal), all in logs 2025M01=0, n.s.a. Source: BLS, and author’s calculations.
The figures come from the Bureau of Labor Statistics’ monthly import price indexes, the government’s regular measure of what U.S. buyers pay for goods from abroad.
The increases are notable given the recent strength in the dollar, which would normally restrain import prices. Exchange-rate pass-through — the degree to which currency movements show up in the dollar prices of imported goods — is typically in the range of 0.30 to 0.35 for the U.S. With the dollar appreciating at an annualized 5.2% over the three months ending in July, measured against the Federal Reserve’s trade-weighted broad dollar index, one would have expected import prices to rise by less than half a percentage point annualized, rather than the 2.6% increase observed.
Figure 2: Three month change in import price for non-petroleum goods vs. three month broad dollar depreciation. Red dots denote observations for post-“Liberation Day”. Source: BLS, Federal Reserve Board, via FRED.
“Liberation Day” refers to April 2, 2025, when the Trump administration announced a sweeping set of “reciprocal” tariffs on U.S. imports, the trade-policy shift that frames the post-April observations highlighted in the chart.
The divergence from the usual relationship could reflect changing production costs in exporting countries, or changing demand in the U.S. from outside forces.
Even so, estimates suggest that the pass-through from faster import-price inflation into either CPI or PCE remains very muted. One structural reason is that much of what the U.S. imports — computers and semiconductors chief among them at the moment — enters as capital goods and industrial inputs rather than finished consumer purchases, so higher import costs reach household inflation only indirectly. Whether the wedge between dollar strength and import prices persists will be legible in the BLS’s monthly releases and in later revisions to these pass-through estimates.

