ICO Statistics 2026: Public Sales Collapse as Venture Funding Surges
Key Takeaways
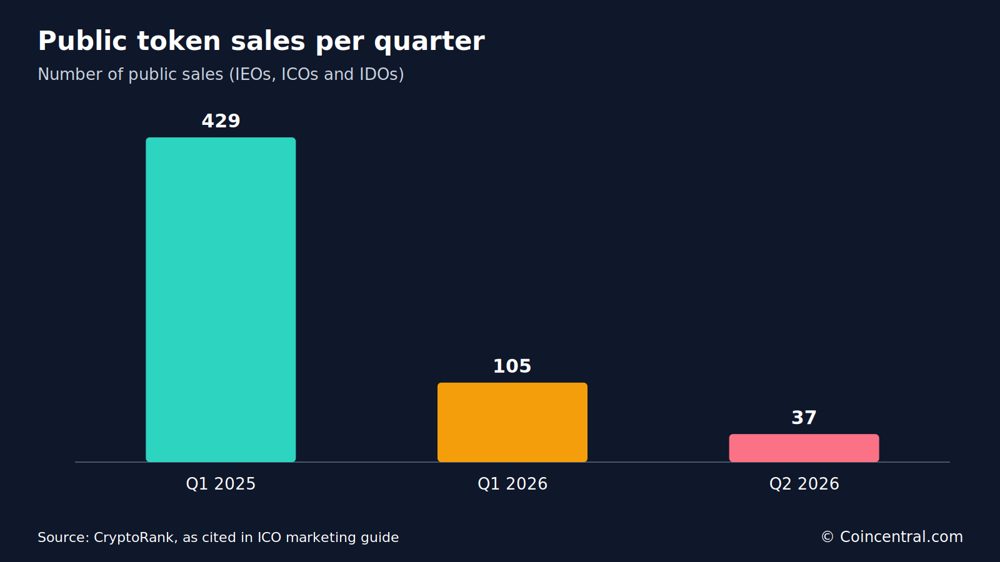
- •Public token sales fell from 105 to 37 deals and raised about $58 million in Q2 2026, an 85 percent quarterly decline and more than fourteenfold contraction from the Q1 2025 peak of $849 million across 429 sales.
- •Venture capital dominates crypto funding, with Q2 2026 totals reported between $3.19 billion and $5.68 billion depending on the source, roughly 55 times public-sale proceeds and increasingly concentrated in later-stage companies.
- •Only 34.5 percent of ICOs reached at least 75 percent of their funding targets in 2025, and a cited study found about 68 percent of ICO tokens traded below their launch price one year on.
- •Higher success rates correlated with KYC checks, audited smart contracts, working products and marketing budgets above $100,000, while 6.3 percent of ICOs showed fraud or rug-pull signs and smart-contract exploits caused more than $41 million in losses.
- •The SEC proposed Regulation Crypto Assets on August 18, 2026, creating exemptions of up to $5 million over four years or $75 million in 12 months, with the public-comment deadline set for October 20, 2026.
Public token sales have changed sharply over the past two years. Some measures showed healthy ICO activity in 2025, but fundraising through open token sales declined substantially in 2026. The figures below cover funding, success rates, investor behavior, risks and regulation. They come from several research firms and data sites, whose methods and totals differ. Where sources report different figures, both are presented rather than combined.
Public token sales fell sharply in 2026
CryptoRank counted 13 public token sales in May 2026, the lowest monthly total since December 2020, when four sales closed. Projects raised about $58 million through IEOs, ICOs and IDOs in Q2 2026, an 85 percent decline from the previous quarter. The number of public sales fell from 105 to 37 over the same period.
Q1 2025 was the peak of the cycle, with $849 million raised across 429 sales. Compared with that peak, disclosed public fundraising had contracted by more than fourteenfold in five quarters. The available figures indicate that crypto capital shifted away from open sales rather than leaving the sector entirely.
Venture capital holds most crypto funding
Venture capital now accounts for most reported crypto funding. Galaxy Research tracks these deals, although reports citing its data provide different Q2 2026 totals. One source reports $5.68 billion across 384 deals, a 31 percent increase in capital from Q1. Later-stage companies received about 78 percent of that amount.
Another source cites $3.19 billion across 739 deals in Q2 2026, with deal count up 8 percent from 682 in Q1. The first source puts first-half 2026 funding at $10.02 billion across 744 deals. The sources do not explain the discrepancy, so Galaxy Research’s original reports should be consulted before any single total is quoted.
Even the lower Q2 figure is about 55 times the $58 million raised in public sales. The data shows larger private checks, particularly for later-stage companies, alongside the decline in public token fundraising. The access question follows from those numbers: public sales are the retail-facing end of token fundraising, while venture rounds are private deals, so fewer open sales mean fewer open allocations for outside buyers even as reported venture capital concentrates in later-stage companies.
Global ICO market and regional distribution
One ICO market report values the global market at $38.1 billion in 2025. It counts 1,096 ICOs launched worldwide and reports 21.7 percent market-value growth, the fastest increase since 2021. These totals are much higher than CryptoRank’s public-sale figures. The sources use different definitions and datasets and should not be added together or compared directly.
North America raised $9.3 billion in 2025, followed by Asia-Pacific with $8.7 billion and Europe with $7.2 billion. Africa and the Middle East raised $1.4 billion, an increase of 43 percent from a smaller base. The average token sale lasted 26 days. Cross-border funds represented 48 percent of contributions, while the number of projects raising funds in stablecoins grew by 31 percent.
By share of all ICOs, North America accounted for 26.4 percent, Asia-Pacific 24.9 percent and Europe 21.7 percent. The Middle East and North Africa represented 11.3 percent, and Latin America 7.5 percent. The United States hosted the most launches, followed by Singapore, Germany, Switzerland and the United Arab Emirates.
ICO success rates
The report defines a successful ICO as one that reaches at least 75 percent of its funding target. On that basis, 34.5 percent of ICOs succeeded in 2025, while 65.5 percent did not.
Results varied by sector. DeFi projects had a 41 percent success rate, followed by infrastructure at 36 percent and NFT projects at 18 percent. Projects that conducted investor identity checks recorded a 38 percent success rate, compared with 26 percent for projects without KYC (know-your-customer) checks. Projects with a working product or prototype reached 42.3 percent.
Marketing expenditure also corresponded with reported outcomes. Projects spending more than $100,000 on marketing had a 47 percent success rate. About 19 percent of 2025 ICOs exceeded their hard cap — the maximum a sale allows itself to raise — primarily in AI and blockchain projects. Sales using early community-governance models reported a 37.5 percent success rate, while multi-chain launches were 28 percent more likely to reach their targets.
Projects with audited smart contracts raised $1.2 million more than unaudited projects. Tiered pricing raised 18 percent more than fixed pricing, and communities with more than 50,000 followers raised 30 percent more. The report also notes a wide gap between the largest raises and the middle of the market.
ICOs, IEOs and IDOs
Token sales generally use one of three formats. An initial coin offering (ICO) is conducted on a project’s own website, an initial exchange offering (IEO) through a centralized exchange, and an initial DEX offering (IDO) through a decentralized exchange or launchpad.
In 2025, ICOs represented 49 percent of token fundraising events, IEOs 32 percent and IDOs 19 percent. Other CryptoRank data cited in the source says IDOs were the most common format by number, indicating that the split depends on the dataset.
IEOs raised the most per project, averaging $6.2 million. ICOs averaged $5.4 million and IDOs $3.7 million. IEOs also had the lowest reported scam rate, below 1 percent, which the source attributes to exchange vetting before listing. The reported rates for ICOs and IDOs were 6.3 percent and 4.9 percent, respectively.
DappRadar’s live tracker shows IDOs dominating its 2026 calendar. It lists 117 live and upcoming sales across 43 launchpads and $103.17 million raised across tracked sales. Only 24 percent of IDOs reached their soft cap — the minimum raise a sale needs to proceed — in 2025. ICOs had the broadest retail participation, involving more than 72 percent of investors.
Blockchains and token types
Ethereum hosted 43 percent of ICOs in 2025. BNB Smart Chain accounted for 21 percent and Solana 13 percent. Polygon represented 9.5 percent, Avalanche 41 percent, Aptos and Sui about 2.2 percent each, and Cardano 1.3 percent.
Ethereum-based projects raised an average of $6.7 million, compared with $5 million for Solana-based projects. Multi-chain ICOs attracted 22 percent more capital than single-chain launches. Cross-chain tools including LayerZero and Wormhole supported 17 percent of ICOs.
Utility tokens made up 71 percent of ICOs, while security tokens accounted for 29 percent. The security-token market doubled to $11.1 billion, with real-estate tokens representing 34 percent of that segment. Among new utility tokens, 52 percent offered staking and 48 percent included governance features. Hybrid models combining utility and security features represented 9.6 percent of ICOs.
Investor profile and behavior
One report describes the typical ICO investor as a retail buyer between 25 and 40. Retail investors represented 61 percent of contributors in 2025, while institutions accounted for 19 percent. Men made up 69 percent of investors and women 22 percent, with the share of women rising.
Mobile wallets and applications processed 56 percent of contributions. The average individual investment was $2,420, and more than 41 percent of investors participated in more than one ICO during the year. About 12 percent used robo-advisers or aggregation platforms to select sales. First-time crypto buyers represented 9 percent of contributors, while investors committing more than $50,000, described in the source as whales, represented 7.1 percent.
Investors seeking staking or yield accounted for 33 percent of backers. Regional interest came from North America at 27 percent, Europe at 24 percent and Asia at 21 percent. More than 43 percent of investors checked token-holder distribution before participating. Telegram hosted groups for 84 percent of upcoming ICOs.
Performance one year after launch
A study cited by one report tracked ICO returns one year after launch and found that most lost value. About 6.89 percent fell below 0.001x of their launch value. Another 32.78 percent returned between 0.001x and 0.2x, while 28.37 percent returned between 0.2x and 1x.
Together, those groups represented 68.04 percent of ICOs that ended the year below their starting price. The remaining 31.96 percent returned 1x or more. Only 6.91 percent returned between 10x and 100x, 1.44 percent reached between 100x and 10,000x, and 0.14 percent exceeded 10,000x.
Token supply and distribution also affect reported outcomes. A launch guide by Vimal Joseph says airdrops providing immediate full access generated about 72 percent more dumping than airdrops using a 90-day vesting schedule, under which tokens unlock gradually rather than arriving all at once. The guide also says airdrops representing less than 10 percent of supply and directed at core users produced a four- to eightfold increase in buyers, while broad distributions roughly doubled the number of sellers.
Total airdrop value declined to $4.5 billion in 2025 from $19 billion the previous year. The average token-vesting period increased to 14 months in 2025.
Failure, fraud and security
The overall ICO failure rate was 65.5 percent in 2025. A lack of product-market fit was cited in 43 percent of failed ICOs, followed by weak marketing and outreach at 41 percent and the absence of a working product at 38 percent. Poor tokenomics was a core issue in 27.6 percent of failures. These causes can overlap.
Teams lacking experience or transparency accounted for 19 percent of failures within six months. Regulatory non-compliance contributed to 14 percent. Projects without external audits failed at 2.4 times the rate of audited projects.
About 6.3 percent of ICOs showed signs of fraud or rug pulls — cases in which teams abandon a project and exit with the funds raised — in 2025. Twelve exit scams were recorded, down from 19 the year before. Smart-contract flaws were exploited in 11 ICOs and caused more than $41 million in direct losses. Phishing attacks on participants rose 14.7 percent, while sybil attacks on whitelist registrations — single actors submitting many entries — increased 22 percent.
More than 81 percent of successful ICOs conducted third-party audits. Projects with bug-bounty programs reported 61 percent fewer incidents.
The wider token market showed similar risks. CoinGecko found that 53.2 percent of approximately 20.2 million tokens launched over five years were no longer actively traded; 11.6 million of those stopped trading in 2025. Chainalysis reported at least $154 billion received by illicit addresses in 2025, including about $17 billion from scams. More than 62 percent of memecoins launched that year were flagged as possible rug pulls within 30 days.
Ethereum’s ERC-20 documentation records more than $83.6 million in tokens lost after being sent to contracts unable to handle them, as of June 2024.
Regulation and compliance
Regulation increasingly affects how token sales are structured. In the United States, the SEC issued a crypto-asset interpretation in March 2026 addressing how securities laws apply to certain crypto assets.
On August 18, 2026, the SEC proposed Regulation Crypto Assets. The proposal would create two exemptions: up to $5 million over four years and up to $75 million during a 12-month period. It includes disclosure requirements and retains antifraud and antimanipulation provisions. For scale, the $75 million 12-month ceiling is roughly fourteen times the $5.4 million average 2025 ICO raise reported above. The proposal is not final, and the public-comment deadline is October 20, 2026.
A separate bill, the CLARITY Act, stalled in the Senate in August 2026. One guide advises projects to plan for either outcome.
In the European Union, the Markets in Crypto-Assets Regulation (MiCA) requires a compliant white paper before a public offer. New form and content rules took effect on December 23, 2025, and filings must use XHTML with inline XBRL tagging. One report says 17 countries had comprehensive ICO rules in 2025 and that 63 percent of ICOs followed at least one compliance framework.
Advertising is another consideration. Google requires advertiser verification and category certification for crypto advertisements, and approval can take six to eight weeks.
Fund allocation and service costs
One report says ICO proceeds are allocated as follows: 75 percent to development and operations, 15 percent to a legal contingency fund, and 10 percent to marketing and community outreach.
A separate launch guide gives a different spending breakdown. It says most teams that complete a raise reserve 10 to 20 percent of the target for audits, legal work, launchpad fees and market making, the practice of supporting post-listing trading liquidity, with paid media receiving the smallest share.
The average pre-launch period was 3.5 months in 2025. The guide recommends 90 to 120 days for compliance and marketing work. Verified Market Reports valued the ICO-services market at $5.3 billion in 2024 and projects it will reach $12.5 billion by 2033, representing a 10.3 percent compound annual growth rate from 2026 to 2033.
Blockchain App Factory lists legal work, audits, KYC systems, marketing, liquidity planning and post-launch support among the costs that reduce the amount of funds available after a raise.
What the figures show
The reported data presents two contrasting funding trends. Public token sales generated about $58 million in Q2 2026, while venture investment reached billions of dollars. In 2025, only 34.5 percent of ICOs reached at least 75 percent of their funding goal. Audits, KYC, working products and marketing spending were associated with higher reported success rates, while fraud, security failures and regulatory issues remained material risks.
Regulatory requirements are continuing to change, including the SEC’s Regulation Crypto Assets proposal, which remained open for public comment until October 20, 2026. Because the underlying sources use different definitions and methodologies, their figures should be reviewed separately rather than treated as a single market total.
Primary source: CoinCentral
Sources cited: ICO Development in 2026: What Has Changed for Crypto Businesses (Blockchain App Factory); ICO marketing in 2026: the complete launch playbook, pre-sale to listing (Vimal Joseph, Medium); Best Crypto ICOs & IDOs 2026 (DappRadar); and ICO Market Statistics 2026: Hidden Opportunities.

