Hyperliquid Seeks Regulated US Derivatives Path as HYPE Tests Key Technical Levels
Key Takeaways
- •Hyperliquid has engaged with both the CFTC and SEC to explore a compliant structure enabling regulated US firms to offer perpetual futures on its blockchain.
- •The discussions do not constitute regulatory approval and focus on whether regulated entities could connect to Hyperliquid's infrastructure within existing US derivatives rules.
- •Hyperliquid's HIP-3 framework allows external builders to deploy perpetual markets for equities, commodities, and other assets after staking 500,000 $HYPE tokens.
- •Approximately $141 million of Hyperliquid's $169 million in second-quarter revenue was directed toward $HYPE token buybacks through its Assistance Fund.
- •$HYPE is trading near $56.89 and testing the 50-day EMA at approximately $58.38, while a 4-hour ADX reading of 17.82 indicates weak trend strength despite recent price gains.
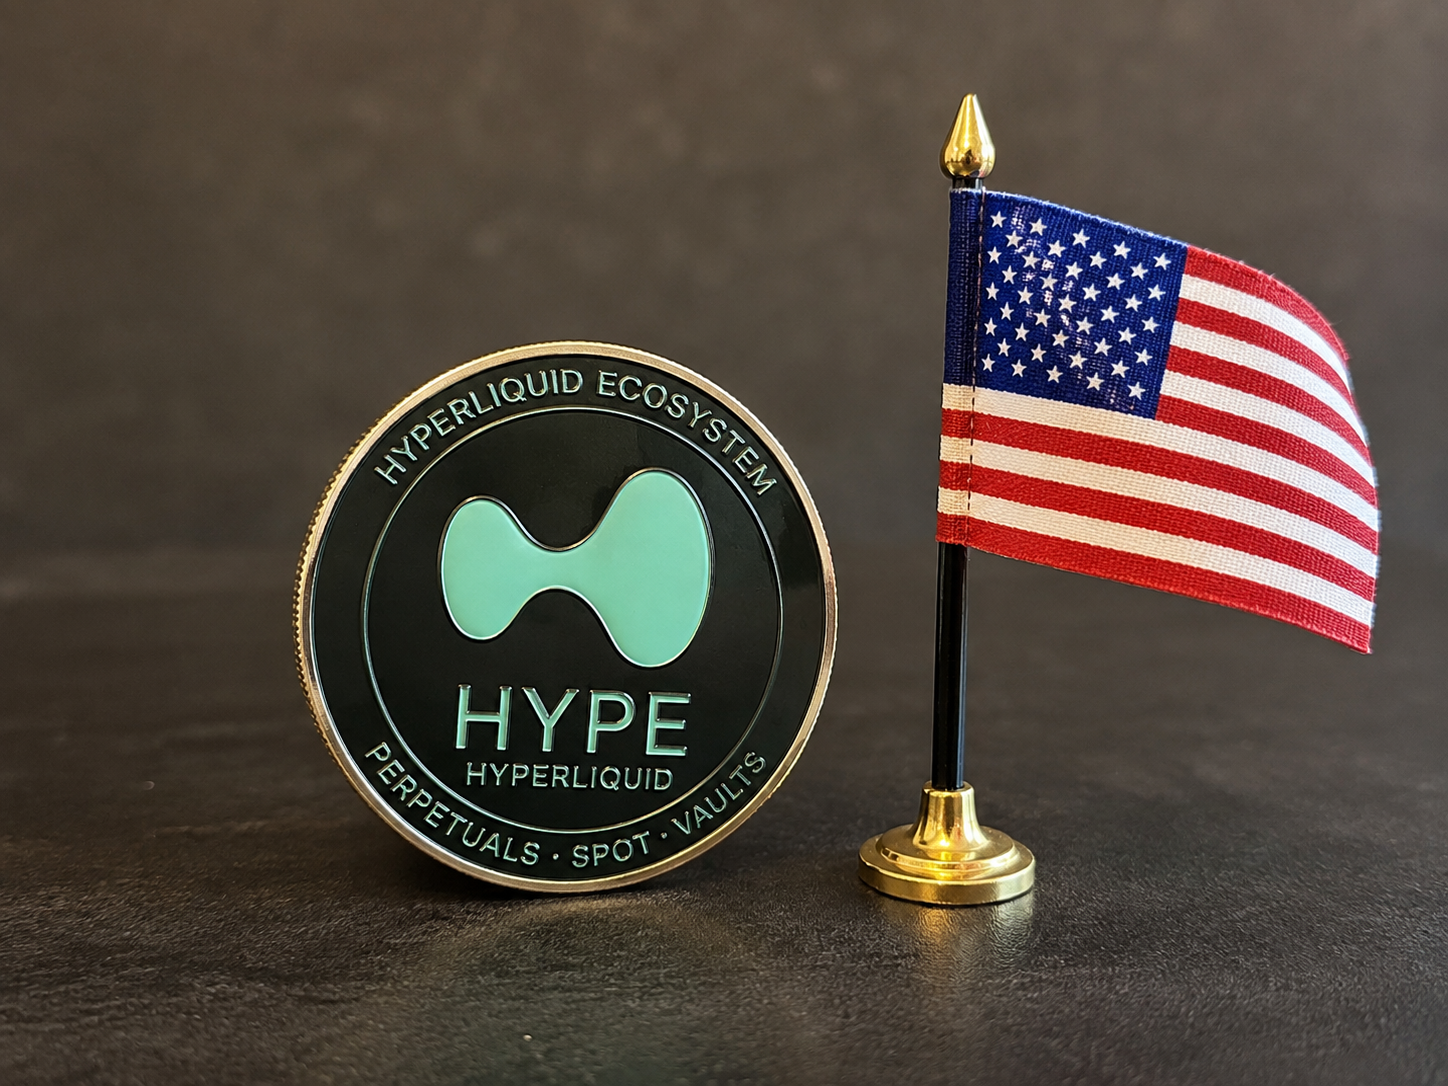
Hyperliquid Seeks Regulated US Derivatives Path as HYPE Tests Key Technical Levels
$HYPE has risen 3.9% over the past 24 hours to $56.78 as Hyperliquid advances efforts to enter the US derivatives market through a regulated framework, while trading activity and demand tied to its HIP-3 markets continue to run at elevated levels.
According to an August 12 report by The Information, Hyperliquid is pursuing a structure that would enable regulated US firms to offer perpetual futures trading and settling on its public blockchain. The project has reportedly been in discussions with both the Commodity Futures Trading Commission (CFTC) and the Securities and Exchange Commission (SEC).
Perpetual futures — derivative contracts with no fixed expiry that have become the dominant instrument in crypto derivatives trading, routinely accounting for the majority of volume on major exchanges — remain largely inaccessible to US users on decentralized platforms. Rather than granting US users — who are currently restricted — direct access to its existing decentralized trading platform, Hyperliquid is said to be exploring alternatives such as no-action letters, regulatory guidance, or another compliant structure that would permit regulated entities to leverage its infrastructure.
These discussions should not be interpreted as regulatory approval for Hyperliquid to launch its perpetual futures platform in the United States. The Information's report centers on whether regulated firms could eventually connect to Hyperliquid's blockchain within the boundaries of existing US derivatives regulations. The dual engagement with both the CFTC and SEC reflects the long-standing jurisdictional overlap between the two agencies over digital asset derivatives, a gray area that has shaped how crypto trading platforms approach the US market.
Regulatory Precedent
Recent developments in the US derivatives landscape have lent some precedent to the proposal. Earlier in 2026, the CFTC greenlit the first regulated perpetual futures products in the country. Separately, Kalshi received clearance in May to offer perpetual-style contracts under the US derivatives framework.
Hyperliquid's regulatory push coincides with robust activity across its derivatives business, with the HIP-3 framework driving an increasing share of that volume.
HIP-3 permits external builders to deploy perpetual markets after satisfying requirements that include staking 500,000 $HYPE. This opens Hyperliquid's infrastructure to contracts tied to equities, commodities, and other non-crypto assets beyond conventional cryptocurrency perpetuals — an expansion that aligns with the broader growth of real-world asset tokenization in decentralized finance. As additional HIP-3 markets come online, the staking requirement has the potential to lock further tokens while generating growing demand from builders seeking access to the platform.
$HYPE buybacks have served as another consistent demand driver. Hyperliquid directs a substantial portion of protocol revenue toward purchasing $HYPE through its Assistance Fund. Reports indicate that approximately $141 million of the $169 million in second-quarter revenue was allocated to token buybacks.
$HYPE Price Analysis: Key Levels in Focus
On the daily $HYPE/$USDT chart, the token was trading near $56.89 on August 13, having recovered from an early-August low of approximately $52.
$HYPE/$USDT 1-day price chart. Source: TradingView.
The recent move has returned the price to a significant cluster of exponential moving averages (EMAs), where the next several daily closes could determine whether the recovery evolves into a more sustained advance.
On the daily chart, the 20-day EMA sits at approximately $56.17, while the 100-day EMA is near $56.64. $HYPE has reclaimed both levels, placing the token back above two averages that had recently marked the upper boundary of its consolidation range.
The 50-day EMA represents the next critical threshold at roughly $58.38. $HYPE is still trading below this average; a daily close above $58.38 would position the price above the 20-day, 50-day, and 100-day EMAs simultaneously. From a structural standpoint, clearing that zone would also push $HYPE beyond much of the trading range that has contained the price since late July.
The EMA configuration has not yet shifted decisively bullish. The 20-day EMA remains below the 50-day EMA, and price has only recently retaken the 100-day average. A failure to hold the $56.17–$56.64 EMA area would place the current breakout attempt under pressure.
Further below, the 200-day EMA stands near $50.88. $HYPE has remained comfortably above this long-term average, with the early-August pullback bottoming around $52 before buyers pushed the price back toward $57.
The daily volume profile adds another dimension to the support structure. A substantial concentration of historical trading activity is visible in the $40–$45 region, with particularly heavy volume around $41. Although that zone sits well beneath the current market price, it marks where significant trading occurred during $HYPE's March-to-May consolidation.
Short-Term Chart Signals
On the 4-hour chart, $HYPE has reached the upper Bollinger Band at approximately $56.96, after moving above the band's middle line at $55.29. The lower band sits around $53.61.
$HYPE/$USDT 4-hour price chart. Source: TradingView.
A sustained 4-hour break above the $56.96 upper band — followed by the price holding above it or the band expanding upward — would support an acceleration of the current move. A rejection, conversely, would bring the Bollinger midpoint near $55.29 back into focus, with $53.61 serving as the next dynamic support should selling pressure intensify.
The ADX indicator provides an important caveat to the 4-hour move. The reading stands at just 17.82, even after turning higher from its recent low. An ADX below 20 signals that the prevailing trend remains weak, indicating the price advance has not yet developed the strength typically associated with a decisive directional move.
For $HYPE, this combination places the $56.96–$58.38 zone as the immediate area to monitor. The first level corresponds to the 4-hour upper Bollinger Band, while the second aligns with the daily 50-day EMA. A breakthrough of both would clear two distinct technical barriers and bring the previous price structure around $60–$62 back into consideration.
On the downside, the daily 20-day and 100-day EMAs near $56.17 and $56.64 form the first support cluster. Below them, the 4-hour Bollinger midpoint at $55.29 and the lower band near $53.61 provide additional levels before the early-August low around $52 and the daily 200-day EMA at $50.88.
For the current advance to mature into a stronger breakout, the 4-hour ADX would need to rise in tandem with price, rather than leaving $HYPE to push through resistance on weak trend strength. The latest chart showed ADX beginning to tick upward at 17.82 as $HYPE tested the upper Bollinger Band near $56.96.

