Hyperliquid (HYPE) Price: Months of Gains Now Hinge on a Single Support Zone
Key Takeaways
- •Hyperliquid (HYPE) traded near $73.61 on Monday, November 9, a 1.14% daily decline that left the token roughly 24% below its October highs near $97.
- •The token is testing the $73–$76 zone, where an ascending trendline built from a February low near $25 overlaps with a band that acted as resistance in June and July before being reclaimed.
- •Nasdaq-listed Hyperliquid Strategies reported spending about $1.58 billion to purchase 25.9 million HYPE tokens, bringing total holdings to roughly 38.9 million with a blended cost basis of $56.35 per token.
- •US spot Hyperliquid ETFs recorded $8 million in net outflows on November 6, the third consecutive day of withdrawals, with outflows from November 4 through November 6 totaling roughly $13.4 million.
- •Momentum indicators favor sellers, with the RSI at 36.12 and a negative MACD, while DefiLlama data shows $86.45 million in 30-day fees and about $67 million in protocol revenue, much of it directed toward HYPE buybacks.
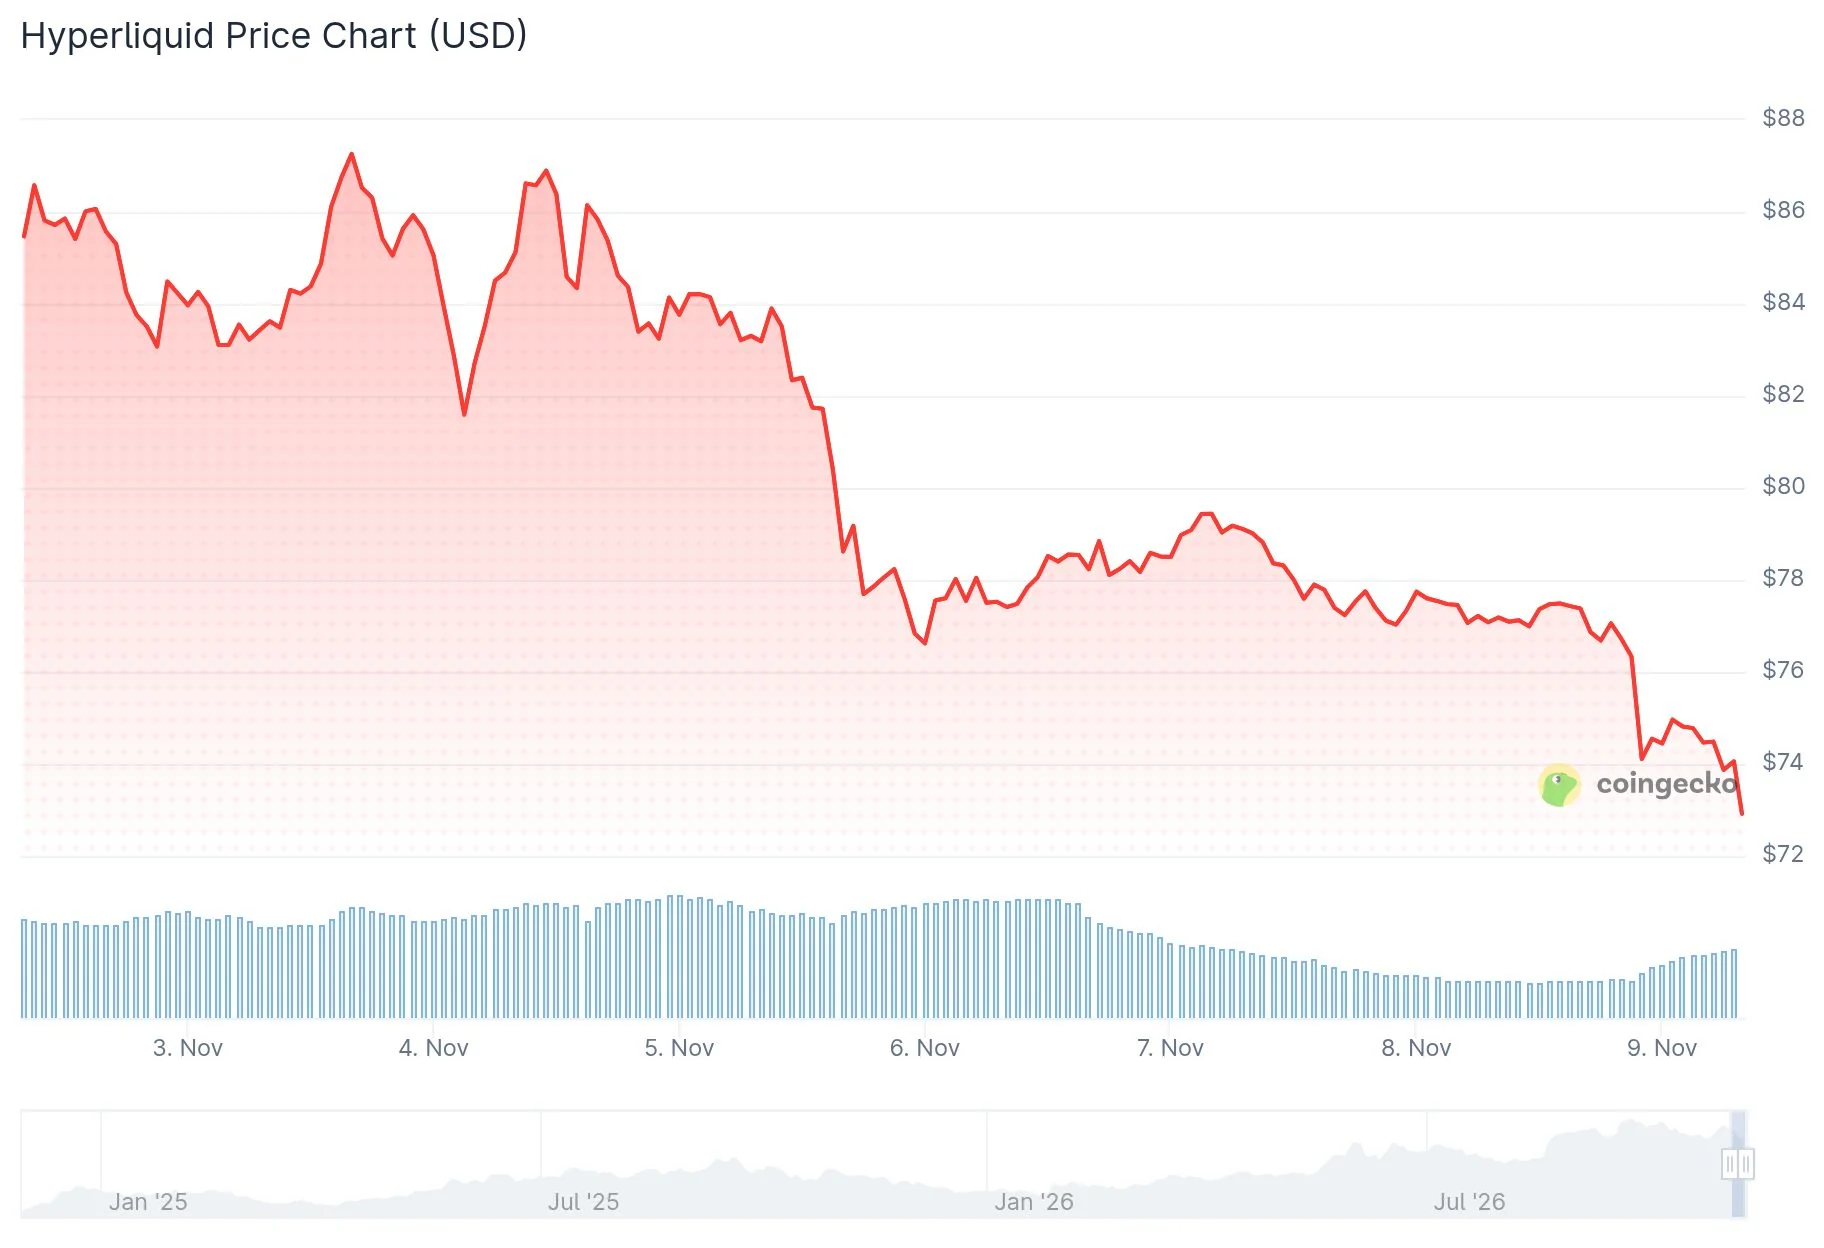
Hyperliquid (HYPE) traded near $73.61 on Monday, November 9, marking a daily decline of 1.14% and leaving the token roughly 24% below its October highs near $97. Buying momentum has faded since that peak, and the price is now pressing directly on the $73–$76 zone. The level matters for two reasons: a long-term ascending trendline runs through it, and the same band acted as resistance during June and July before being reclaimed. The pullback has brought the token to a technically significant juncture, with attention fixed on whether this support can hold. That makes the current test a reference point for whether the uptrend built since February remains structurally intact.
Institutional Treasury Keeps Buying
Hyperliquid Strategies (PURR), a Nasdaq-listed company, reported third-quarter results on November 5. The firm disclosed that it spent about $1.58 billion to purchase 25.9 million HYPE tokens, bringing total holdings to roughly 38.9 million tokens as of October 28. Its blended cost basis is $56.35 per token — below the current market price of $73.61 — and it reported $245.3 million in cash and cash equivalents. Because listed treasury vehicles like this one hold HYPE directly on their balance sheets, their periodic filings serve as some of the most direct public records of institutional accumulation for the token.
The company also said it plans to expand its institutional trading infrastructure. According to its disclosure, the Hyperliquid ecosystem produced about $834 million in value accrual over the 12 months ending September 30, driven by trading fees and related activity.
ETF Flows Turn Negative
Spot ETF net flows — the difference between money entering and leaving funds on a given day — are widely tracked as a running measure of fund-level demand.
US spot Hyperliquid ETFs recorded $8 million in net outflows on November 6, the third straight day of withdrawals, according to CryptoETF.today. Bitwise's BHYP accounted for $7.1 million of that total, while 21Shares' THYP saw $900,000 leave. Outflows from November 4 through November 6 amounted to roughly $13.4 million, though the November 6 data was incomplete because only two of the three tracked funds had reported.
On-chain activity remained substantial. DefiLlama data from November 9 shows $5.59 billion in perpetual futures volume over 24 hours, open interest of $7.31 billion, and total value locked near $7.94 billion. The protocol earned about $2.31 million in fees over the same 24-hour span, and across 30 days fees reached $86.45 million, with protocol revenue for the period at approximately $67 million — much of which goes toward HYPE token buybacks. For protocols that channel revenue into buybacks, fee and revenue figures are read as a direct link between trading activity and the token's supply dynamics.
Technical Indicators Lean Toward Sellers
Momentum readings currently favor the downside. The Relative Strength Index (RSI) sits at 36.12, below the neutral 50 level but above the oversold threshold of 30, meaning momentum has weakened without reaching conditions typically described as oversold. The Moving Average Convergence Divergence (MACD) is negative as well: the MACD line stands at -1.718, below its signal line at -0.980, and the histogram reads -0.738, indicating short-term momentum is running beneath its longer-term trend signal.
Head and shoulders setups are among the most widely recognized chart patterns, and their breakdowns are traditionally watched by technicians as potential signs of a trend reversal. Adding a bearish chart view to the support test already underway, analyst Nebraskangooner posted on X that the $HYPE head and shoulders pattern is starting to break down.
🚨 $HYPE HEAD AND SHOULDERS IS STARTING TO BREAK DOWN 🚨 pic.twitter.com/7rUdRZemHb
— Nebraskangooner (@Nebraskangooner) November 8, 2026
Trendline Built From February Low Faces Its Test
HYPE constructed its ascending trendline after a low near $25 in February, with the line connecting higher lows in March, May, and August. That ascending structure has framed the token's advance for much of the year. HYPE then rose above $90 in September and October before sellers pushed it back, and the latest drop has produced a series of lower highs. Monday's intraday low came in at $73.13. Because the daily candle was still open, a confirmed breakdown had not yet occurred — in standard chart-reading practice, a trendline break is confirmed only by a daily close beneath the, leaving intraday moves below it provisional.
Levels That Frame the Next Move
If support holds, the first resistance sits at $78–$80. A move above $80 could open the way to $85 and then $90, with a stronger resistance zone between $90 and $95.
If HYPE closes below $73 on the daily chart, the first downside target is $68–$70. Below that, the $60–$65 region could come into play, and a deeper drop could reach $53–$55, where HYPE made a higher low in August.
A bullish MACD crossover would be one sign of improving momentum, an RSI move above 45 would be another, and rising volume on a rebound from the $73–$76 zone would also support the case for buyers. Alongside those chart-based signals, the daily ETF flow reports and Hyperliquid Strategies' future disclosures offer recurring data points for tracking demand from funds and institutional treasuries.
Source: CoinCentral

