HYPE Signals Caution on Weekly Chart as Momentum Slows
Key Takeaways
- •HYPE reached $83 before pulling back, leaving the $77-$78 area as the market’s main support test after the breakout.
- •The weekly RSI formed a lower peak during the rally, creating a bearish momentum divergence versus the higher price high.
- •A weekly close below $77-$78 would point traders toward the $71-$72 support cluster and could signal a deeper correction.
- •If the $71-$72 confluence fails, the next technical support levels are $67 and $63 based on Fibonacci retracements.
- •Hyperliquid generated about $6.2 million in protocol fees on Aug. 23, helping fund Assistance Fund buybacks of HYPE tokens.
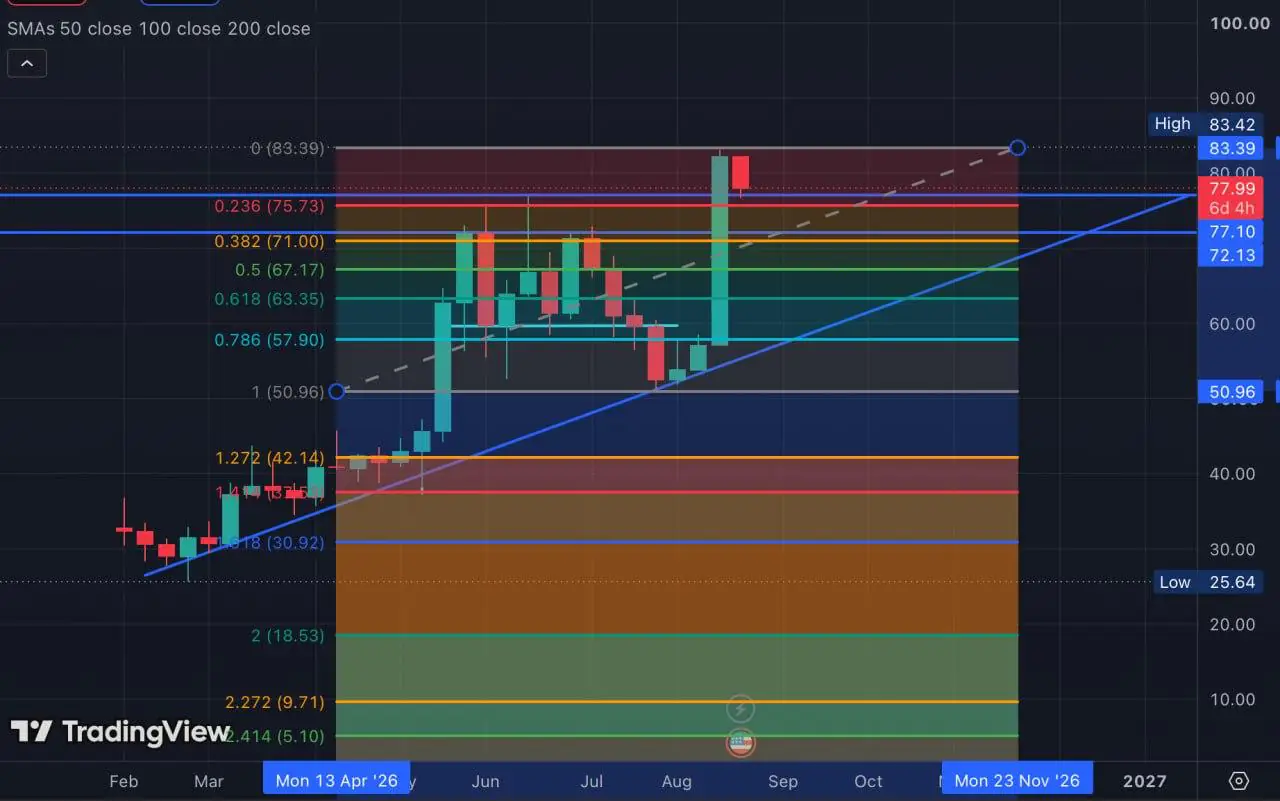
With the rally pausing, the former resistance zone around $77 is now the key level for buyers to defend.
Higher Highs, Slower Momentum
HYPE, the native token of the decentralized exchange Hyperliquid, climbed to $83 before pulling back toward its prior range. The move broke through previous highs, but the weekly Relative Strength Index (RSI) — an oscillator that tracks the pace and magnitude of recent price changes — formed a lower peak than it did during the earlier rally.
That pattern is a classic weekly momentum divergence: price makes a higher high while the momentum indicator posts a lower high. Divergence alone does not signal an immediate sell-off or provide a precise downside target. Instead, it suggests the latest advance came with less aggressive buying volume than the move that produced the prior RSI peak.
Technical warnings only matter once price confirms them. In HYPE's case, that confirmation depends on whether buyers can hold the area they reclaimed during the recent surge.
The $77 Support Test
The previous record area between $77 and $78 served as HYPE's long-term resistance ceiling. After breaking out toward $83, the market returned to test that zone from above in an effort to establish it as new support.
Short-lived intraday wicks below $77 on lower time frames are less important here, since weekly candle closes provide the cleaner signal and filter out short-term noise. Each weekly close also compresses a full week of trading into a single data point, which is why chartists weigh it more heavily than daily or intraday prints. A weekly close below $77-$78 would show that buyers failed to defend the breakout zone and could open the door to a deeper decline. By contrast, holding above $77 keeps the broader uptrend intact despite the softer weekly RSI reading.
Our team already identified $77 as the key level buyers need to defend in this move. The weekly RSI divergence adds importance to that zone, but it does not create a separate thesis on its own.
Key Support Levels Below $77
If HYPE closes a week below $77, the chart points to a major support cluster in the $71-$72 area. That zone has technical confluence, combining the 0.382 Fibonacci retracement near $71 — one of the pullback ratios traders project from the Fibonacci sequence to map likely correction depths — with an ascending weekly trendline that has supported HYPE's advance for months.
A move into the $71-$72 range would still fit within a normal correction inside a larger rally rather than an immediate structural breakdown. However, losing both the $77 breakout floor and the trendline confluence below it would provide stronger technical evidence that the weekly momentum divergence is developing into a multi-week retracement.
If that confluence fails, additional Fibonacci support levels sit at $67, which marks the 0.5 retracement, and $63, which marks the 0.618 retracement. Those levels are logical areas to watch if the main support zone gives way.
Protocol Fundamentals Still Provide Support
While the chart is flashing caution, Hyperliquid's underlying network metrics remain strong. As previously reported, the platform generated roughly $6.2 million in protocol fees on Aug. 23. A designated portion of those fees flows into the Assistance Fund, which buys HYPE tokens from the open market.
Automated market purchases would not prevent a broad sell-off, but ongoing protocol buybacks can create a structural floor that purely speculative tokens do not have. Active trading volume continues to support recurring, protocol-driven demand for the token alongside general market activity. Because the Assistance Fund is funded directly from trading fees, ongoing fee generation is the fundamental metric to monitor alongside the chart levels, as buyback capacity rises and falls with platform usage.
What Would Confirm the Next Move
The bearish technical scenario still requires clear price confirmation. A weekly close below $77-$78 would shift attention to the $71-$72 support zone. If that trendline confluence also fails, the $67 and $63 Fibonacci levels would come into focus.
The invalidation path is straightforward. If buyers defend $77 and HYPE posts a weekly close back above $83, the momentum divergence would lose its immediate technical relevance. That move would return the chart to price discovery and force traders to reassess momentum at higher levels.
At the time of writing, HYPE shows neither a confirmed breakdown nor a clear continuation higher. The market is still testing whether demand can defend a former breakout zone while weekly momentum cools.
This article is provided for informational purposes only and does not constitute investment advice.

