HYPE Price Stalls at Descending Channel Despite First Positive ETF Week
Key Takeaways
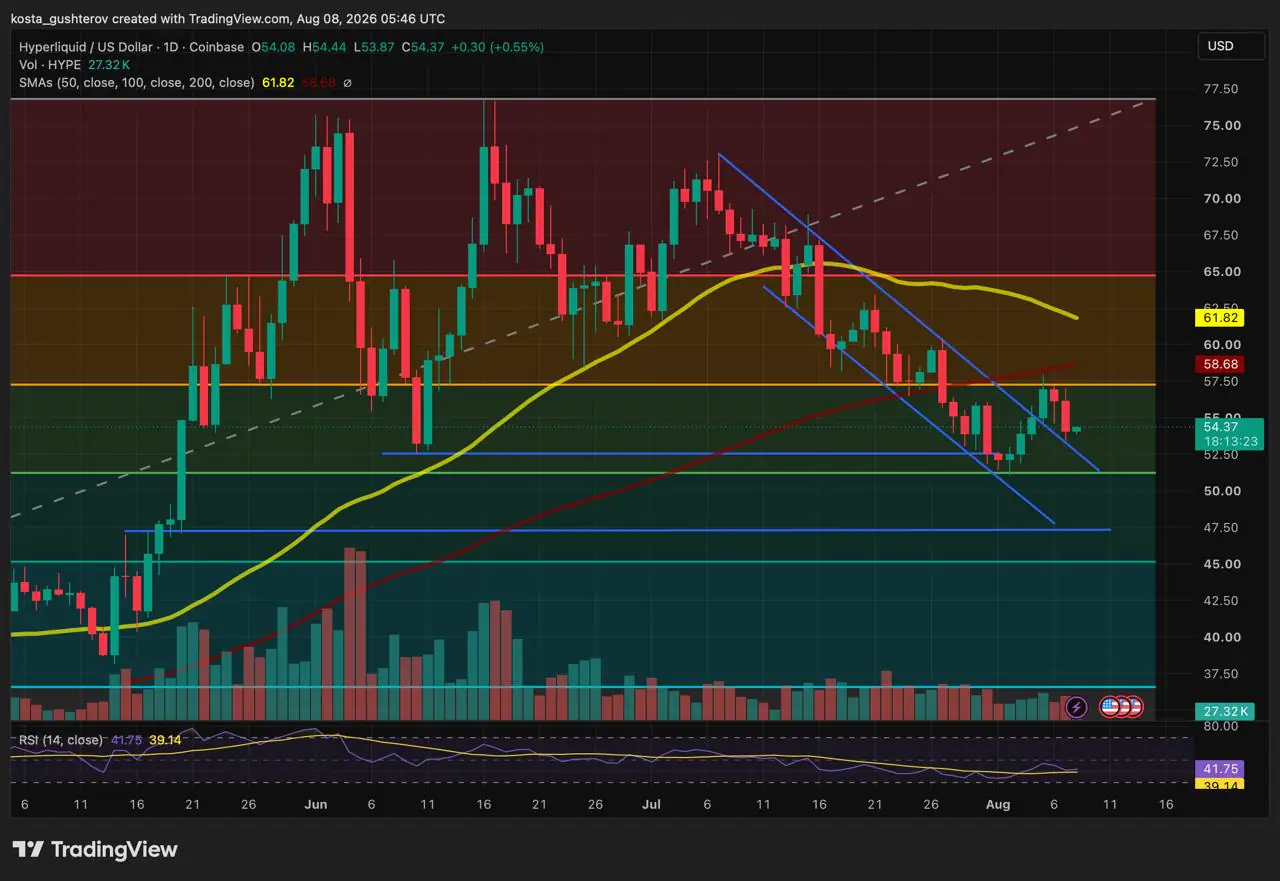
- •HYPE was rejected from the $57–$58 resistance zone and fell to approximately $53.5 on August 7 before partially recovering to around $54.5.
- •The token is testing the upper boundary of a descending channel, with holding above it crucial for sustaining the recent breakout attempt.
- •HYPE spot ETFs recorded $2.84 million in net inflows for the week ending August 7, ending three consecutive weeks of outflows totaling $30.62 million.
- •The Relative Strength Index sits near 42, below the neutral threshold, indicating limited evidence of strong bullish momentum.
- •HYPE continues to trade below both its 50-day and 100-day simple moving averages, with decisive resistance clustered around $57.5–$58.7.
HYPE, the native token of Hyperliquid's decentralized perpetual exchange, is trading near the upper boundary of its descending channel, even as spot ETFs record their first positive week following three consecutive periods of outflows.
The pullback flagged earlier this week has materialized. As noted in Coindoo's August 5 HYPE analysis, resistance around $57–$58 combined a horizontal price barrier with the 100-day simple moving average. Failing to break through that zone left the recovery exposed, with support near $52 below.
Momentum had been fading alongside bearish RSI divergence, increasing the risk of another pullback. HYPE was rejected from that resistance and dropped toward $53.5 on August 7, returning price to the upper boundary of the descending channel that has defined the broader slide from July highs.
Buyers stepped in around that level, and HYPE has partially recovered. At the time of writing, the token trades near $54.5.
HYPE Returns to the Top of Its Descending Channel
HYPE now sits at a technically critical juncture. Holding above the upper channel boundary would sustain the recent breakout attempt, while slipping back below it would return price inside the descending structure.
The first major resistance is around $57.5. Just above, the 100-day SMA sits near $58.68, forming the same resistance cluster that halted the latest recovery.
A decisive break above that area would expose the 50-day SMA near $61.8. Further up, $64.5–$65 represents a resistance zone where HYPE repeatedly stalled during July.
On the downside, the first significant support lies around $52.5–$51, which helped contain the early-August decline. Losing that zone would open support near $47.5, followed by approximately $45.
The Relative Strength Index is currently near 42 and remains below the neutral 50 threshold. The indicator has bounced from its recent low, though evidence of strong bullish momentum remains limited.
HYPE ETFs End Three-Week Outflow Streak
The ETF landscape has improved following a difficult July. According to SoSoValue data, HYPE spot ETFs recorded $2.84 million in net inflows for the week ending August 7.
This follows three consecutive negative weeks: $7.26 million in outflows through July 17, $8.61 million through July 24, and $14.75 million through July 31.
Weak ETF demand was also highlighted in JPMorgan's recent assessment of Hyperliquid, as covered by Coindoo. Fading fund demand had removed a key source of support for the token.
The latest inflow breaks that streak for now, though $2.84 million remains modest compared with the $30.62 million withdrawn over the preceding three weeks. Sustained positive readings would be needed to confirm a genuine reversal in ETF demand.
What Matters Now for HYPE?
The recent bounce has averted an immediate breakdown, yet HYPE continues to trade below both the 100-day and 50-day moving averages.
The key technical contest is between the channel boundary and the $57.5–$58.7 resistance cluster. Reclaiming that zone would reinforce the recovery attempt, while falling back into the channel would place the $52.5–$51 support under renewed pressure.
ETF flows have at least stabilized for the moment. A more convincing technical recovery would require continued improvement in fund demand rather than a single positive week.
Methodology: The analysis uses the HYPE/USD daily chart captured on August 8, 2026, incorporating price structure, horizontal support and resistance levels, the 50-day and 100-day simple moving averages, the descending channel, and the Relative Strength Index. ETF flow data are sourced from SoSoValue.
Disclaimer: This article is provided for informational and educational purposes only and does not constitute financial or investment advice. Technical levels are not guarantees, and cryptocurrency prices can change rapidly.

