HYPE Price Faces First Major Test After Rebound From $77
Key Takeaways
- •HYPE’s rebound from support near $77 has brought the token to resistance around $80.50-$81.
- •The four-hour RSI has formed a bearish divergence as price rose to a higher high while RSI made a lower high.
- •A daily close above $80.50 and a successful retest would provide stronger evidence of a breakout from the descending channel.
- •Further resistance is located between $81.50 and $84, while a break below $77 could expose the $75 and $70.33 retracement levels.
- •The Senate’s expected September 15 CLARITY Act vote, the Federal Reserve decision, and broader crypto-market moves could influence HYPE’s technical setup.
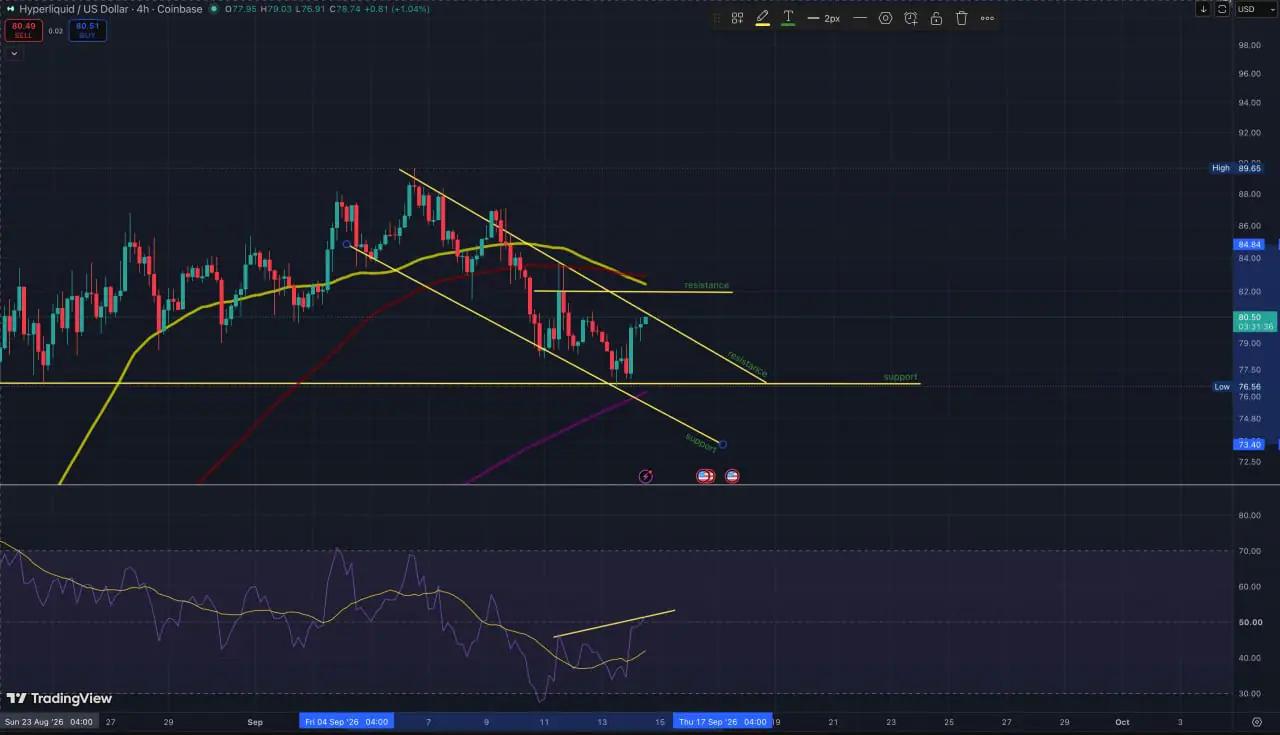
HYPE has rebounded from support near $77, but a bearish momentum divergence and several resistance levels around $80.50 leave the next daily close as a key technical test.
HYPE rebounds into a crowded resistance zone
HYPE declined toward $77 before the sell-off began to slow. The area combined previous horizontal support, the four-hour 200-period simple moving average and the lower boundary of a descending channel.
No individual technical level guarantees that a price will hold. However, the convergence of these levels made $77 an area where buyers were more likely to defend the market. The subsequent rebound has carried HYPE toward the opposite side of the channel, where resistance is stronger.
HYPE traded near $80.50 at the time of writing, placing the token close to a major technical decision point.
Bearish RSI divergence signals weaker momentum
The four-hour relative strength index, or RSI, has formed a bearish divergence. HYPE’s price recorded a higher high during the recovery, while the RSI made a lower high. The divergence indicates that upward momentum has not strengthened alongside the price advance.
A bearish divergence does not always result in a decline, but it becomes more significant when it develops near resistance. A decisive move above the channel would weaken the warning, while a rejection at the upper boundary would reinforce it.
Why $80.50-$81 is the key resistance area
HYPE traded near $80.50 on Coinbase when the analysis was published, directly below the four-hour channel boundary around $80.50-$81. The daily 0.236 Fibonacci retracement is also positioned near $80.50.
The retracement was drawn on the Coinbase HYPE/USD daily chart from the August swing low near $51 to the subsequent high around $89.60. Based on that advance, the 0.236 retracement is approximately $80.50, the 0.382 level is near $75, and the halfway retracement is around $70.33. The chart is available through TradingView.
These levels indicate how much of HYPE’s August advance has been given back. Because the price fell below the 0.236 retracement and is now approaching it from underneath, $80.50 is functioning as resistance. A rejection there would keep the deeper retracement levels near $75 and $70.33 in focus.
What would confirm a breakout?
HYPE would first need a four-hour close above the channel to break the short-term downtrend. A daily close above $80.50 would offer stronger confirmation, especially if a later pullback held that level as support.
Even after such a move, HYPE would face another resistance zone between $81.50 and $84. The four-hour 50- and 100-period simple moving averages are clustered in that area. Buyers would need to clear the entire zone before the recent high near $89.60 became relevant again.
Trading volume could help distinguish a sustained breakout from a temporary move above resistance. A close supported by stronger-than-recent four-hour volume would carry more weight than an isolated candle formed on low volume.
Rejection would put $77 back in focus
A brief move above the channel followed by a close back inside it would resemble a failed breakout and leave the short-term descending structure intact. Combined with the bearish RSI divergence, that result would shift attention back to the $77 support area.
A decisive break below $77 would expose the daily 0.382 Fibonacci retracement near $75. HYPE has not revisited that level since its August advance, making it a deeper test of the rally. A daily close below $75 would then bring the 0.5 retracement around $70.33 into view.
Broader market events could affect the setup
HYPE’s chart identifies the immediate decision points, but any breakout attempt will take place within broader crypto-market conditions. Several events this week could affect risk appetite across the market.
The Senate is expected to hold a procedural cloture vote related to the CLARITY Act on September 15. Attention will then shift to the Federal Reserve’s policy decision. Coindoo’s analysis of Bitcoin entering Fed week explains why policymakers’ guidance may matter as much as the decision itself.
A sharp move in Bitcoin or the broader market could override HYPE’s technical setup before either buyers or sellers establish control.
HYPE remains at a technical decision point
The rebound has improved HYPE’s short-term position, but it has not reversed the descending structure. With momentum weakening near resistance, an intraday move above $80.50 would be less significant than a confirmed daily close followed by a successful retest. That sequence would give traders a clearer indication that the former resistance area had changed into support, while a rejection would leave the existing range and downside levels relevant.
This article is provided for informational purposes only and does not constitute financial or investment advice. Technical levels can change as market conditions develop.

