HYPE Price Breaks Out of Descending Channel; Key Levels at $80 Support and $85–$87 Resistance
Key Takeaways
- •HYPE gained 4% on October 27 to trade near $82, pushing the token above the upper boundary of a descending parallel channel that had framed its pullback for several weeks.
- •Crypto.com launched regulated HYPE perpetuals for US traders the same day, and Kraken's parent company Payward is seeking approval for a permissioned US market on Hyperliquid, though that remains a proposal rather than an approved market.
- •The broken channel boundary aligns with the 0.382 Fibonacci retracement near $80 to form a doubled support layer, while the 50-day moving average near $85 and the 0.236 Fibonacci level around $87 create the nearest overhead resistance.
- •HYPE holds above both its 100-day and 200-day moving averages, and the RSI has crossed back above 50, though the margin is thin and the current trading range is under 2% with no follow-through yet.
- •A daily close holding above $80 would keep the breakout intact and open room toward the $85–$87 resistance zone, while a close back below $80 would invalidate the structure and open a mean reversion toward the $75–$76 support tier.
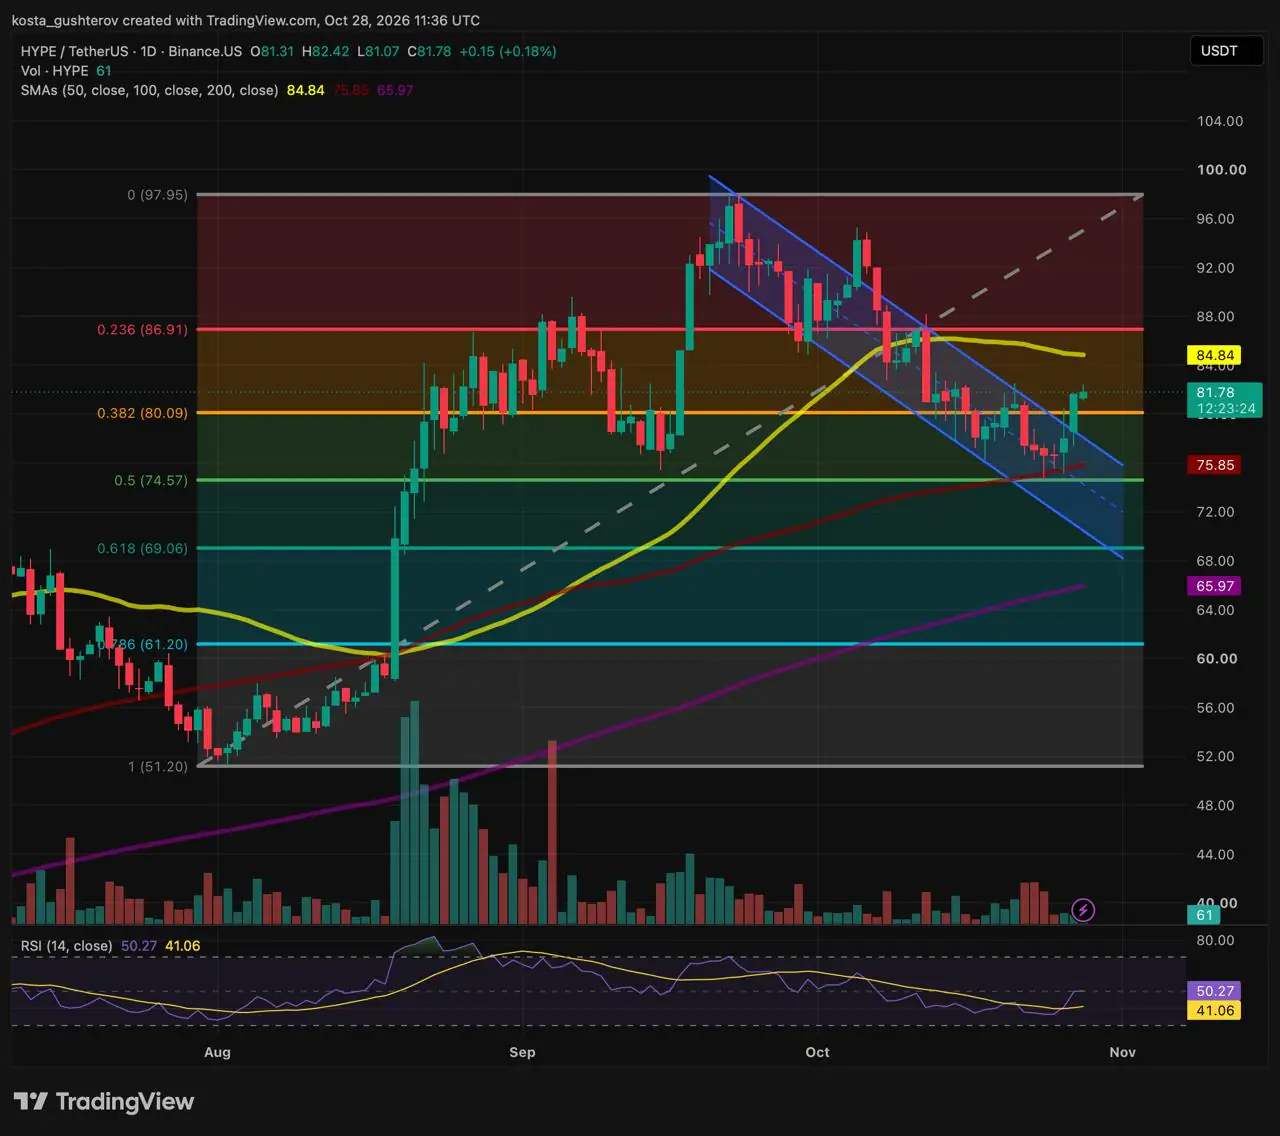
HYPE traded around $82 on the Binance HYPE/USDT daily chart after rising 4% on October 27, the same day Crypto.com opened HYPE perpetuals to US traders. The gain pushed Hyperliquid's token above the upper boundary of a descending parallel channel that had framed its price action for several weeks.
The impulse that carried HYPE from roughly $51 to its cycle peak near $98 ended in a slow, orderly retreat. On the chart, that pullback unfolded inside a descending parallel channel — two falling trendlines that capped each bounce and caught each dip over several weeks. Price has now pushed above the channel's upper line.
The current session is calm by comparison, up about 0.2% and trading inside a narrow range between $81 and $82. According to Coindoo's analysis, that quiet matters: a breakout with no follow-through often drifts back toward the line it just broke, as traders check whether old resistance now behaves as support. That may happen here, or price may move away without looking back.
The case for the breakout — and the case against
The argument in favor: price is out of the channel that defined the entire pullback. The broken boundary lines up with the 0.382 Fibonacci retracement near $80 — one of the standard pullback zones traders project between a swing's low and high, here between the roughly $51 launch point and the near-$98 cycle peak — giving any pullback a double layer of support. HYPE also holds above both its 100-day and 200-day moving averages, the longer-horizon trend markers on the daily chart, and the relative strength index (RSI), a momentum oscillator, has crossed back over 50, against a signal line near 41.
The argument against: the 50-day simple moving average (SMA) near $85 is still overhead, so the short-term trend has not turned. The 0.236 Fibonacci level close to $87 stacks right on top of it. RSI sits only a fraction above the midline, and the current range is under 2%, with no follow-through yet.
Put together, the breakout has changed HYPE's structure without yet changing its trend. The analysis reads the move out of the channel as a possible shift from corrective compression back toward trend resumption. If the old boundary and the 0.382 Fib hold on any pullback, buyers will have shown real commitment, and the path opens toward the 50-day SMA and the 0.236 Fib — a heavy resistance zone that has to give way before the cycle high is back in play.
The momentum picture tells the same story in miniature. An RSI back above 50 tilts intermediate momentum toward buyers, but the margin is thin enough that one weak session could erase it.
What sits above, and what sits below
The levels around the current price stack as follows:
- Macro peak resistance: the 0 Fib and the cycle swing-high ceiling.
- Primary overhead resistance: the 50-day SMA near $85 and the 0.236 Fib around $87 form a heavy cluster.
- Active pivot: the 0.382 Fib near $80 meets the broken upper channel boundary.
- Secondary structural floor: the 0.5 Fib close to $75 paired with the 100-day SMA near $76.
- Macro base: the 0.618 golden pocket around $69 meets the 200-day SMA near $66.
- Macro baseline floor: the 1.0 Fib, the launch platform of the original impulse.
The asymmetry is the notable part. The nearest support is about 2% away and backed by two separate signals, while the nearest resistance is roughly 4% away and also doubled up. HYPE sits in a tight box between the two, and a daily close outside it will say more than any intraday swing.
Scenarios, not forecasts
Daily closes holding above the 0.382 Fib near $80, with the broken channel boundary acting as support, would keep the breakout intact and leave room to extend into the $85–$87 resistance zone.
A daily close back inside the channel, below $80, would invalidate the breakout structure and open a deeper mean reversion toward the $75–$76 support tier.
Either way, even the lower tier would keep HYPE above its 200-day SMA and golden pocket, meaning the longer climb from about $51 would survive a failed breakout. A return to the $98 peak, on the other hand, has to go through the resistance cluster first.
Away from the chart, HYPE's US access has widened this week. Crypto.com's regulated perpetuals arrived on Tuesday, and Kraken's parent company, Payward, is seeking approval for a permissioned US market on Hyperliquid itself — a proposal, not yet an approved market. The direction of travel is the same in both cases: established trading venues building regulated US pathways to Hyperliquid, although only Crypto.com's product is live so far. On the chart, though, the signal worth waiting for is simpler: the next daily close on either side of the box between $80 and $85.
Disclaimer: This article is provided for informational purposes only and does not constitute financial or investment advice. Technical levels and scenarios do not guarantee future price movement.

