HYPE Price Analysis: Key Levels on the Path to a New All-Time High
Key Takeaways
- •HYPE must reclaim the $86-$87 zone to repair the recent breakout structure.
- •A weekly close above $89.6 and the rising channel ceiling would confirm a move toward new all-time highs.
- •The September 8 dragonfly doji remains unconfirmed because the following daily candle was still open when the chart was captured.
- •Bearish RSI divergence shows weakening upward momentum, although it does not confirm a reversal without a support breakdown.
- •The four-hour channel and nearby moving averages support the advance, while a breakdown could target $77.1.
According to a September 9 Coindoo analysis, HYPE remains confined to its rising four-hour channel, with the 50- and 100-period moving averages still underpinning price action. A dragonfly doji on the daily chart awaits confirmation, while a bearish RSI divergence signals that upward momentum is fading. The latest record breakout remains unconfirmed, leaving $89.6 as the main upside test.
Weekly Breakout Faces Its Confirmation Test
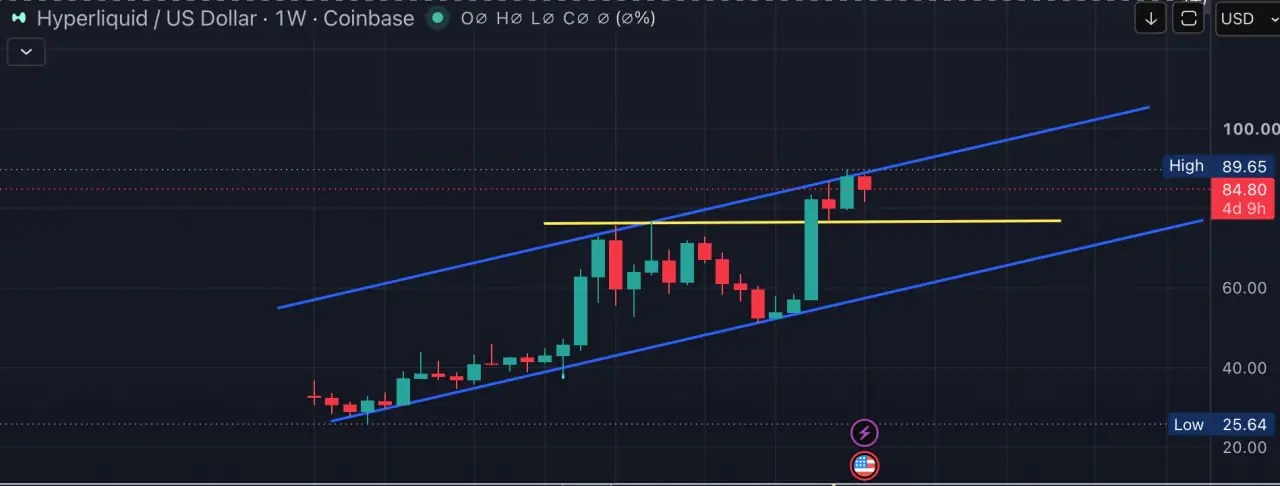
The weekly chart shows HYPE maintaining its broader advance inside a rising channel. Price has moved decisively above resistance near $76.8, although the latest push to a record high has not yet secured full confirmation.
The earlier breakout to a record high near $90 initially turned $86-$87 into the nearest support. HYPE has since slipped below that area, making it the first zone buyers need to reclaim. Regaining $86-$87 would repair the latest breakout structure, and a weekly close above $89.6 and the rising channel boundary would return the token to price discovery, where no historical trading levels remain to act as resistance. The current weekly candle remains open, so its final position carries more weight than an intraday move through either level.
Another rejection at the channel ceiling could send price back toward $76.8. The broader weekly advance would remain intact above that support, whereas a close below it would raise the risk of a failed breakout and a deeper correction.
Key weekly levels:
- $89.6 — current record high and channel resistance
- $86-$87 — lost breakout support and the immediate reclaim zone
- $76.8 — broader weekly breakout support
Daily Dragonfly Doji Awaits Confirmation
The September 8 candle formed a dragonfly doji, a pattern in which the opening, closing, and session-high prices sit near the same level, leaving a long lower wick and little or no upper wick. HYPE fell sharply during the session before buyers rejected the lower prices and pushed it back toward its opening level.
Traders typically wait for the next daily candle to close before acting on the pattern. A green close above the doji high would provide the clearest bullish confirmation and support another attempt at the upper channel boundary. A green candle that remains below the doji high would offer only partial confirmation.
The September 9 candle was still open when the chart was captured, so its color and closing level were not confirmed. A close below the doji high would leave the pattern unresolved, while a break below its low would weaken the bullish interpretation.
The RSI introduces a separate warning. Price has formed higher highs during the advance, whereas the indicator has produced lower highs. This bearish divergence suggests upward momentum is weakening, though price must lose support before it becomes evidence of a reversal.
Key daily levels:
- Around $82-$83 — doji wick and lower channel support
- $87.5-$89.6 — upper channel and immediate resistance
- $77.1 — major support following a channel breakdown
Four-Hour Channel Keeps Short-Term Support Intact
The four-hour chart shows HYPE continuing to trade inside the ascending channel that has guided price since August. Repeated reactions at both trendlines make the channel a useful gauge of whether the short-term advance remains intact.
The 50-period and 100-period simple moving averages converge near the lower channel boundary, strengthening that area as short-term support. Holding above both averages would preserve the sequence of higher lows and keep the upper boundary within reach. A four-hour close below the channel and both moving averages would turn the latest dip into a short-term breakdown, with the $77.10 horizontal level becoming the next major area to watch.
Key four-hour levels:
- Around $83-$84 — lower channel and moving-average support
- $88-$89.6 — upper channel and record-high resistance
- $77.1 — first major support below the channel
The Path to a New All-Time High
HYPE retains its broader rising structure, but the latest record breakout remains unconfirmed. The daily RSI shows weaker momentum, and price must still reclaim the support lost after the recent pullback. A move back above $86-$87 would provide the first sign that buyers are regaining control. HYPE would then need a weekly close above $89.6 and the channel ceiling to establish a new all-time high.
Failure to reclaim the breakout zone would leave the price vulnerable to a deeper test of support.
This article is for informational purposes only and does not constitute financial advice.
