Single-Family Home Prices Down 11% to 26% From Peak in 15 Larger US Cities as San Francisco Exits the List
Key Takeaways
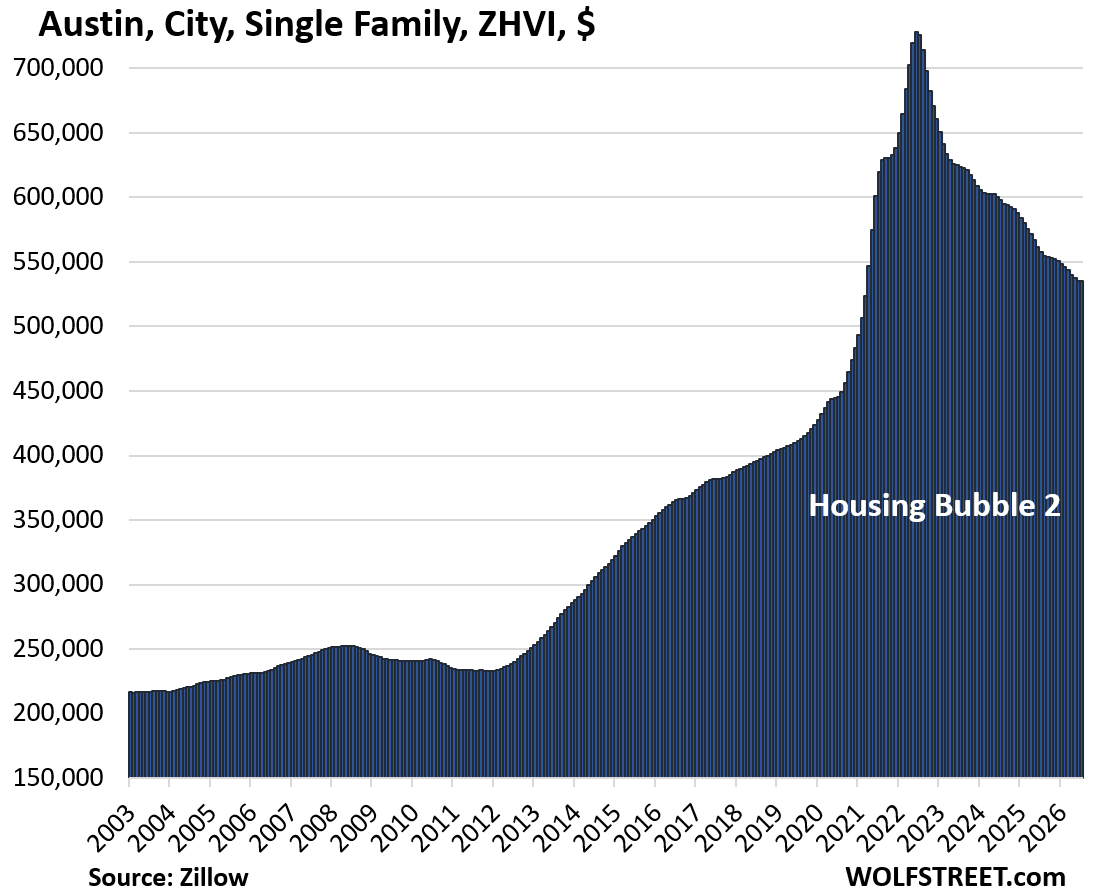
- •Through July, mid-tier single-family home prices in 15 larger markets were down 11% to 26% from peaks that mostly occurred in mid-2022, after the average 30-year fixed mortgage rate rose from roughly 3% to above 7% following the Fed's first rate hike in March 2022.
- •Austin recorded the largest decline at 26%, followed by Oakland at 24%, with Hayward (-13%) and Contra Costa County (-12%) completing California's three East Bay entries and three Florida counties also making the list.
- •San Francisco dropped off the list as its year-over decline narrowed from 15% to 6%, a shift Wolf Street attributes to spending by AI companies such as Anthropic.
- •Homebuilders in the Dallas-Fort Worth area, where McKinney fell 14% and Fort Worth 11%, are buying down mortgage rates and offering incentives on new construction, putting competitive pressure on the existing-home market.
- •The declines come against a weakened demand backdrop, with national pending home sales falling to their second-lowest level on record.
Local housing markets rarely move in lockstep. This analysis tracks larger markets where prices of mid-tier single-family homes have fallen substantially from their respective peaks in prior years — in other words, where the affordability crisis has become less severe.
Through July, prices of mid-tier single-family homes in the 15 larger cities and counties on this list had declined by 11% to 26% on a seasonally adjusted basis from their peaks, which occurred mostly in mid-2022, with two of the markets peaking in 2024. Those mid-2022 peaks coincided with the surge in borrowing costs that followed the Federal Reserve's first rate hike in March 2022: the average 30-year fixed mortgage rate climbed from around 3% at the start of 2022 to above 7% by that autumn, sharply worsening affordability for buyers who depend on financing.
The inclusion threshold was raised to -11% from -10% for July in order to keep the list tidy. When this sporadic series began a year ago, the cut-off was 8%, producing a compact list of just 10 markets, with the largest decline at 22%. Five additional larger cities posted price declines of 10%. The price declines are also unfolding against a broadly weakened demand backdrop — pending home sales nationally have dropped to their second-lowest level on record, as covered in the related piece below.
Texas
Austin tops the list with a 26% drop. The enormous Dallas-Fort Worth area places two cities on the list: McKinney (-14%) and Fort Worth (-11%). Other larger cities in the metro area did not make the list, including Frisco (-10%), Garland (-9%), Plano (-9%), Arlington (-7%), and the city of Dallas (-7%).
The Dallas-Fort Worth area has attracted large numbers of businesses and residents for years and has been a target of homebuilders, with new developments springing up as part of what is known as "The Texas Miracle." Those new homes now compete with existing homes for sale. Homebuilders, who must sell the homes they have built in an increasingly difficult market, have been buying down mortgage rates, offering lower price points, and throwing incentives at buyers — and the existing-home market is feeling that pressure. Such incentives became a fixture of the homebuilding industry as mortgage rates stayed elevated long after the 2022 spike, giving new construction a pricing and financing lever that individual resale sellers generally lack.
Elsewhere in Texas, San Antonio (-10%) barely missed the raised cut-off, while Houston (-5%) and Corpus Christi (-3%) remain at a safe distance from it.
California
California has three markets on the list: Oakland (-24%); Hayward (-13%), on the eastern shore of the San Francisco Bay; and Contra Costa County (-12%) in the East Bay, comprising Concord, Antioch, Pittsburg, Walnut Creek, Richmond, San Ramon, and many other smaller cities. All three are East Bay markets that saw steep pandemic-era price run-ups before peaking.
San Francisco, however, has come off the list. In July a year ago, the city ranked fourth with a decline of 15%; this year its drop has narrowed to 6% as money from AI companies such as Anthropic has been thrown around left and right and the market has started going haywire — a shift Wolf Street characterizes as AI mania running the housing market.
Other California cities still at a safe distance from the cut-off include Sacramento (-9%), Stockton (-8%), San Jose (-6%), San Diego (-4%), and Los Angeles (-4%).
Florida
Florida has three counties on the list. The cities within those counties — many of them well-known — are individually too small to qualify, but the counties are large enough. The state's single-family market is not nearly as weak as its condo market, where the bottom has fallen out in a number of markets. That condo weakness reflects pressures specific to the sector, including soaring insurance premiums across the state and, following the 2021 Surfside condo collapse, state rules requiring older buildings to pass structural inspections and set aside reserve funds — costs that fall on condo owners and associations in particular.
Below the cut-off
There are many other larger cities where mid-tier single-family home prices have declined from their respective peaks in prior years, but by less than 11%. Among larger markets, San Antonio and Frisco, both at -10%, sit nearest to the current threshold — and the list's composition has already shifted noticeably since the series began, with San Francisco having ranked fourth a year ago before dropping off entirely.
Methodology and data
These prices are seasonally adjusted three-month averages of single-family mid-tier homes — the middle tier of homes by value within each market — in "cities" or "counties." All data are from the Zillow Home Value Index (ZHVI), which is based on millions of data points in Zillow's "Database of All Homes," drawing on public records (tax data), MLS, brokerages, local Realtor associations, real-estate agents, and households across the US. It includes pricing data for off-market deals and for-sale-by-owner transactions. These are not median prices.
For the 15 larger cities with price declines of 11% to 26%, the metrics reported for each market are, from left to right: the price decline from the peak, the month-over-month change (MoM), the year-over-year change (YoY), and the remaining increase since January 2000.
Source: Wolf Street
