Household Equity Holdings Now Exceed 2000 Peak as Share of Net Worth, Econbrowser Estimates Show
Key Takeaways
- •Household equity holdings in 2026Q2 and Q3 represent 31% of household net worth, exceeding the 26% share at the 2000 peak.
- •Equity holdings have risen a bit over 40% so far, compared with the 60% increase leading up to the 2000 peak.
- •Because equities make up a larger slice of net worth than in 2000, a given swing in equity valuations now moves measured household wealth by more than it did at that time.
- •Beach, Gamber and Moran (2025) attribute the decline in the marginal propensity to consume out of wealth to rising wealth concentration, estimating it at about 3.4 cents per dollar in 2000 and 2.6 cents as of 2019.
- •A $3 trillion wealth decline of the kind experienced last week would reduce consumption by roughly $80 billion—a modest amount against about $22.5 trillion in Q3 nominal consumption—though a shift in the trend would produce a much larger effect.
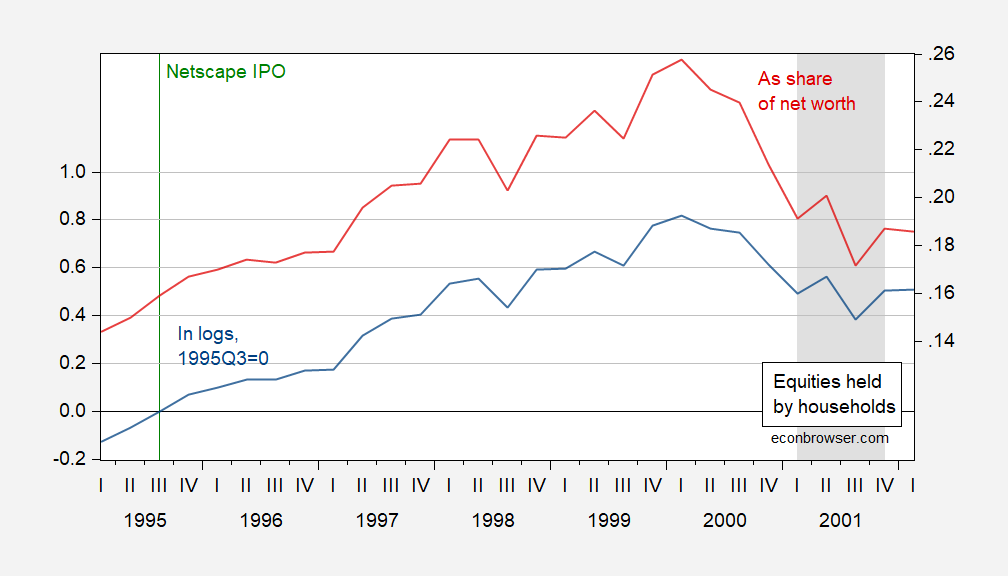
Household equity holdings in 2026Q2 and Q3 represent a larger share of household net worth than at the 2000 peak, according to new estimates published by Econbrowser.
The estimates draw on Flow of Funds data from the Board of Governors of the Federal Reserve, series from the Bureau of Economic Analysis (BEA), and NBER-defined recession dates, together with the author's calculations.
Figure 1 plots PCE-deflated equities and mutual funds held by households, in logs indexed to 1995Q3=0 (blue, left scale), alongside equities and mutual funds held by households as a share of net worth (red, right scale), with NBER-defined peak-to-trough recession dates shaded gray. Figure 2 presents the same series, with the 2026Q2 and Q3 equity holdings estimated from a first-log-differences regression of holdings on the S&P 500 value over 2022–2026.
The comparison shows that equity holdings have risen by a bit over 40% so far, compared with a 60% climb to the peak in 2000, while the share of household net worth is currently higher, at 31% versus 26% in 2000. That composition difference is part of why the comparison draws attention: with equities making up a larger slice of net worth, a given swing in equity valuations now moves measured household wealth by more than it did at the 2000 peak. The 2000 benchmark also carries historical context — the NBER dates the recession that followed it from March 2001 through November 2001.
The central question is the implication for consumption. Analysts once distinguished between paper wealth and real wealth such as real estate. Beach, Gamber and Moran (2025) attribute the decline in the marginal propensity to consume (MPC) out of wealth to increasing wealth heterogeneity and concentration, estimating the MPC at about 3.4 cents on the dollar in 2000 and about 2.6 cents as of 2019.
On those estimates, a $3 trillion reduction in wealth — roughly the decline experienced last week — would amount to an $80 billion reduction in consumption. Set against Q3 nominal consumption of about $22.5 trillion on a seasonally adjusted annual rate (SAAR), this is a small reduction in and of itself. The analysis notes, however, that were the trend to shift along with the one-time drop, the reduction in consumption would be much more noticeable. Since the 2026Q2 and Q3 holdings figures are regression-based estimates, upcoming Federal Reserve Flow of Funds releases will provide the official quarterly readings to check them against, while BEA consumption reports will show how spending data evolve alongside the wealth swings.

