HBAR price prediction 2026-2032: Can Hedera Hashgraph retest its all-time high?
Key Takeaways
- •HBAR is trading near $0.07172 after breaking above the $0.068-$0.070 range it had held for weeks.
- •Resistance is currently seen at $0.072-$0.075, and a daily close above $0.075 could strengthen bullish momentum.
- •The recent move was driven by short covering, derivatives momentum, record daily transaction volume, and steady spot ETF inflows.
- •The article says HBAR’s 2026 forecast is a low of $0.1874, a high of $0.2416, and an average of $0.218.
- •For 2029 and 2032, the article projects HBAR at an average of $0.6367 and between $0.4875 and $0.6167, respectively.
Key takeaways:
- In 2026, HBAR is expected to trade between $0.1874 and $0.2416, with an average trading price of $0.218.
- In 2029, HBAR is expected to trade at a maximum of $0.7513 and an average of $0.6367.
- By 2032, HBAR could trade between $0.4875 and $0.6167, with an average price of $0.5521.
HBAR price prediction — Hedera Hashgraph (HBAR) is a cryptocurrency that benefited from the bullish crypto market of 2021, like many other altcoins. As a result, traders and investors have since taken a keen interest in the digital asset. In addition, the Hedera Hashgraph network is widely viewed as a potential force in the blockchain space.
Every crypto investor asks the same question: when will HBAR’s price rise again?
Overview
HBAR price prediction: Technical analysis
Hedera Hashgraph (HBAR) price analysis
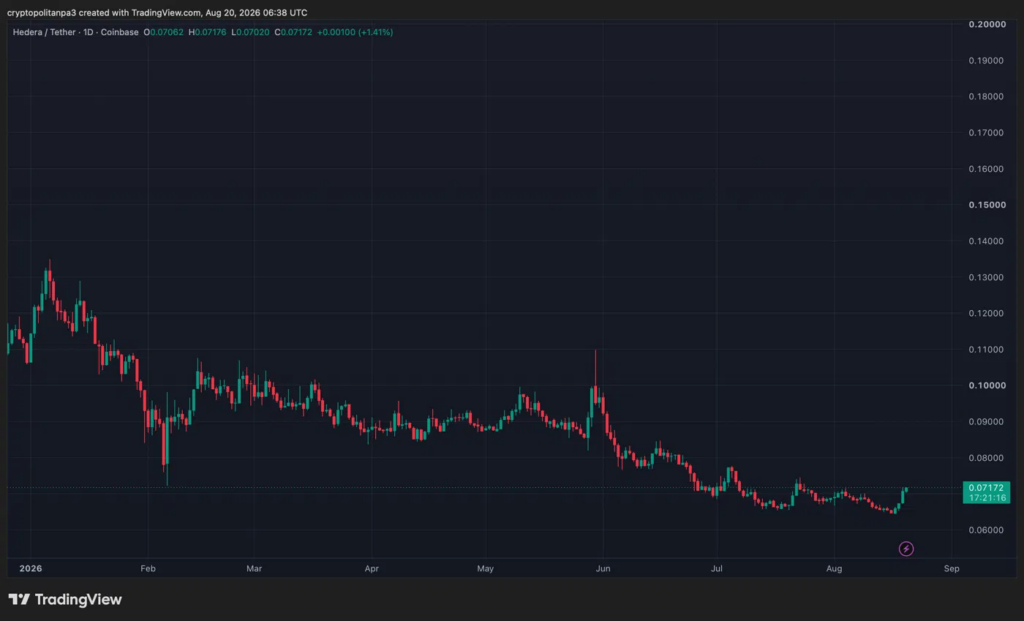
HBAR is trading near $0.070–$0.072, up roughly 1.4% to 5% today, after breaking above the tight $0.068–$0.070 range it had held for weeks since mid-July on a surge in trading volume.
Support now sits at $0.068–$0.070, the former resistance zone that has turned into support, while resistance is positioned at $0.072–$0.075. A daily close above $0.075 could open a path toward $0.08–$0.09, while a failure to hold $0.068 risks a move back into the prior range.
The breakout appears to have been driven by short covering and derivatives momentum, reinforced by fundamentals such as record daily transaction volume and steady spot ETF inflows, with no full week of net outflows. That combination points to genuine institutional interest behind the move.
HBAR price analysis: 1-day chart
HBAR/USDT is trading at $0.07172, up 1.41% today, after breaking above the narrow $0.068–$0.070 consolidation range it held for weeks since mid-July. The chart shows a long, steady decline from January’s $0.135 peak, and the latest move is the first meaningful upside breakout in months.
Price is now testing resistance near $0.072–$0.075, an area that has capped several bounce attempts since June. Immediate support sits at $0.068–$0.070, the recently broken consolidation zone. A daily close above $0.075 would confirm bullish momentum and could open a path toward $0.08–$0.09, while a failure to hold above $0.070 risks a return to the prior range.
HBAR/USD 4-hour price chart
HBAR/USDT is trading at $0.07172, up 1.41% today, after breaking above the tight $0.068–$0.070 consolidation range it held for weeks since mid-July. The chart shows a long decline from January’s $0.135 peak, with this latest move representing the first meaningful upside breakout in months.
Price is testing resistance near $0.072–$0.075, an area that has capped multiple rebound attempts since June. Immediate support is located at $0.068–$0.070, the recently broken consolidation zone. A daily close above $0.075 would confirm bullish momentum and could open a path toward $0.08–$0.09, while a failure to hold above $0.070 risks slipping back into the previous range.
HBAR technical indicators: Levels and action
Daily Simple Moving Average (SMA)
Daily Exponential Moving Average (EMA)
What can you expect from the HBAR price analysis next?
Based on the current technical setup, HBAR appears positioned to test the $0.072–$0.075 resistance zone in the near term after today’s breakout above the $0.068–$0.070 range it held for weeks. A daily close above $0.075 would confirm bullish momentum and could open a path toward $0.08–$0.09, echoing the June relief rally highs.
However, because the move follows months of decline, some consolidation or a pullback to retest $0.070 as new support would be a healthy sign before further upside. A failure to hold $0.068 would raise doubts about the breakout’s durability and could risk a slide back toward $0.065.
Why is HBAR up today?
HBAR’s rally is being driven mainly by short covering and derivatives momentum, with short sellers repeatedly caught off guard as price pushed above a key ascending trendline. Additional support came from fresh fundamentals: Hedera recorded a record daily transaction volume, averaging 291,200 transactions per day, and its spot ETF has not recorded a full week of net outflows, while holding more than 1.6% of circulating supply. That suggests steady institutional demand.
A bullish engulfing candle near a critical trendline on August 18 also triggered trend-following buying. Taken together, the move reflects a technical breakout reinforced by network adoption and institutional interest rather than pure speculation.
Is HBAR a good investment?
Hedera Hashgraph distinguishes itself through its Hashgraph consensus algorithm, which is designed to offer higher speed, security, and scalability than traditional blockchain technologies. That positions HBAR as a potentially innovative project in distributed ledger technology, with applications in smart contracts and decentralized applications (dApps).
These features could help HBAR reach new highs in the coming months and years. However, this article does not provide investment advice.
Will HBAR reach $1?
HBAR reaching $1 is possible, but it depends on several key factors, including market conditions, adoption rates, and broader crypto sentiment. HBAR has strong fundamentals, including fast, low-cost transactions and backing from major enterprises.
If adoption expands across DeFi, NFTs, and enterprise applications, demand for HBAR could increase. However, competition from other layer-1 blockchains and regulatory factors may slow growth. A bullish crypto cycle and wider institutional interest would likely be necessary for HBAR to reach $1. Sustained utility and investor confidence would also be important for long-term price appreciation.
What will HBAR be worth in 2026?
By 2026, HBAR is expected to be worth $0.2416.
How much will HBAR cost in 2030?
By 2030, HBAR is expected to be worth a maximum of $0.3066.
Can HBAR reach $20?
HBAR reaching $20 would require an extraordinary market rally and widespread adoption, making it highly unlikely. With HBAR’s current circulating supply of around 33 billion tokens, a $20 price would imply a market capitalization of $660 billion, placing it among the largest cryptocurrencies and rivaling Bitcoin and Ethereum.
Where to buy HBAR?
Traders and investors can buy Hedera Hashgraph (HBAR) on centralized exchanges including Binance, KuCoin, HTX, Bybit, Bitget, and others.
Will HBAR reach $10?
HBAR reaching $10 is highly unlikely and would require a massive increase in market capitalization. Predictions for 2030 estimate HBAR could reach between $0.2294 and $0.3066, making $10 an unrealistic target without extraordinary market changes.
Will HBAR reach $100?
Hedera Hashgraph (HBAR) reaching $100 is highly ambitious and would require exceptional growth, widespread adoption, and extreme market speculation.
Does HBAR have a good long-term future?
HBAR has the potential for a long-term future if it continues to gain popularity and adoption. Analysts project a market price of about $0.2416 by 2026 and $0.3066 by 2030. However, as with all meme coins, its future is uncertain and highly dependent on market trends and community support.
Recent news/opinion on HBAR
Hedera has joined Mastercard’s Crypto Partner Program, collaborating with Mastercard and ecosystem partners to enable on-chain cross-border money movement, B2B transactions, and settlement. The move marks a significant institutional milestone for Hashgraph.
Hashgraph has joined the @Mastercard Crypto Partner Program. What that means in practice: collaborating with Mastercard and ecosystem partners to facilitate on-chain cross-border money movement, B2B transactions, and settlement. This is what Hashgraph has been building for.… pic.twitter.com/h69aAa5JjN — Hashgraph (@hashgraph) August 4, 2026
Hashgraph has joined the @Mastercard Crypto Partner Program. What that means in practice: collaborating with Mastercard and ecosystem partners to facilitate on-chain cross-border money movement, B2B transactions, and settlement. This is what Hashgraph has been building for.… pic.twitter.com/h69aAa5JjN
Hedera Hashgraph price prediction August 2026
The price of Hedera is expected to be at least $0.0648 in August 2026. The price of Hedera can reach $0.0953, while the average trading price is $0.082.
HBAR coin price prediction 2026
By 2026, HBAR’s average market price is expected to be $0.218, with a potential low of $0.1874 and a potential high of $0.2416.
Hedera Hashgraph forecast 2027-2032
HBAR price prediction 2027
The price of Hedera (HBAR) is predicted to reach a minimum of $0.0822 in 2027, a maximum of $0.1059, and an average trading price of $0.094. This projection is driven by Hedera’s expanding enterprise adoption, governance by leading global organizations, and increasing real-world use cases in tokenization and supply chain, supporting gradual but sustainable price growth.
HBAR price prediction 2028
The price of 1 Hedera (HBAR) is expected to reach a minimum of $0.1945 in 2028, with a maximum of $0.2461 and an average of $0.2203. This outlook is supported by rising enterprise integrations, broader adoption of Hedera’s Hashgraph technology for fast and low-cost transactions, and expanding tokenization and DeFi projects, which are strengthening network demand and value.
HBAR price prediction 2029
According to analysts, in 2029 the price of Hedera (HBAR) is expected to range from $0.5105 to $0.7346, with an average of $0.6225. This growth is expected to come from increased global adoption of Hedera’s enterprise-grade network, broader tokenization initiatives, and expanding partnerships across finance, supply chain, and sustainability sectors, driving higher demand and ecosystem value.
HBAR price prediction 2030
The price of Hedera (HBAR) is predicted to reach a minimum of $0.2302 in 2030, a maximum of $0.3077, and an average of $0.2689. This projection is fueled by Hedera’s growing role in enterprise blockchain solutions, the increasing tokenization of real-world assets, and the expansion of network utility through decentralized applications, creating consistent demand and long-term value appreciation.
HBAR price prediction 2031
According to a deep technical analysis of historical HBAR price data, in 2031 the price of Hedera is forecast to range from a minimum of $0.3153 to a maximum of $0.3777, with an average trading price of $0.3465. This outlook is supported by Hedera’s maturity as a leading enterprise-grade distributed ledger, expanding partnerships with global corporations, and increasing adoption in tokenized assets, payments, and carbon markets, all of which strengthen its long-term growth trajectory.
HBAR price prediction 2032
The price of Hedera (HBAR) is predicted to reach a minimum of $0.4875 in 2032, a maximum of $0.6133, and an average trading price of $0.5491.
This growth projection is driven by Hedera’s global enterprise integration, government-level blockchain adoption, and leadership in energy-efficient transactions, making it a preferred choice for sustainable and scalable decentralized applications worldwide.
Hedera market price prediction: Analysts’ HBAR price forecast
Cryptopolitan’s Hedera Hashgraph price forecast
According to Cryptopolitan, HBAR is expected to reach a maximum price of $0.2371 by the end of 2026 and $0.0847 in 2027. Note that the predictions are not investment advice.
Hedera Hashgraph’s historic price sentiment
In 2019, HBAR started at a negligible value, fluctuated, and ended the year near $0.01.
HBAR opened 2021 at $0.03 and rose to $0.10 by early February due to active network developments.
In 2024, HBAR peaked at $0.1793 in April, dropped to $0.051 by September, then rebounded to $0.30 in December, closing the year around $0.29.
In January 2025, trading was stable between $0.30 and $0.31, ending at $0.30.
In February, HBAR dipped to the $0.25–$0.26 range, then declined further in March to around $0.20.
By June, HBAR traded between $0.17 and $0.18 after closing May at $0.1874.
HBAR ended June at $0.147. At the start of July, HBAR increased and traded at $0.16.
HBAR declined from approximately $0.25 on July 31 to about $0.23 on August 2, 2025, before rebounding slightly to around $0.24 by August 3, 2025.
From August to September 6, HBAR showed steady growth, climbing from around $0.065 to nearly $0.095 as investor optimism rose following new enterprise partnerships and increased network activity.
From September 6 onward, HBAR traded mostly between $0.075 and $0.10 as buying slowed after earlier gains and investors waited for clearer signals from the broader market.
Here are five key price-history snapshots for Hedera (HBAR) from early October to early November 2025:
- On October 4, the price closed around $0.2171 after opening near $0.2256.
- By October 10, HBAR had plunged to approximately $0.1644, marking a notable drop from the start of the month.
- Between October 15 and 17, the token hovered in the $0.165–$0.190 range, with October 17 closing around $0.1625.
- In late October, from October 21 to 26, HBAR ranged between roughly $0.1705 and $0.1726, showing relative stability.
- By November 3, HBAR had traded in the $0.170–$0.185 range, indicating a modest recovery from the October lows.
Early November: HBAR traded around $0.072–$0.075, with mild upward volatility and a brief test of $0.078 before losing momentum.
Mid-November: The price trended down to the $0.060–$0.065 range amid broader market weakness and low liquidity. HBAR briefly dipped near $0.058 around November 20–22.
Late November to December 7: HBAR consolidated tightly between $0.058 and $0.063, showing low volatility and weak recovery signals, hovering around $0.060–$0.061 in early December.
Around December 5, 2025, HBAR was about $0.1339 and then traded lower into late December, with prices near $0.1117 by December 31, 2025, showing a mild downward trend as the month progressed.
In early January 2026, HBAR rose modestly from about $0.1063 on January 1, 2026, to roughly $0.1288 by January 6, 2026, indicating a short rebound after the December lows.
Hedera (HBAR) traded between $0.083 and $0.079 from January 6 to late January 2026, then gradually declined to the $0.070–$0.068 range as bearish momentum intensified.
From early February to March 16, 2026, HBAR continued trending lower, briefly stabilizing near $0.066 before fluctuating between $0.062 and $0.065 as the market entered a consolidation phase.
HBAR entered May 3 trading around $0.087, after spending months compressed in the tight $0.085 to $0.095 range, before spiking to a May high of $0.116. That move was driven by Canary Capital ETF inflows and Hedera’s integration with the U.S. insurance market, before fully retracing back toward $0.088 by month’s end.
By June 3, HBAR was trading around $0.095 to $0.114, showing signs of gradual recovery as the CLARITY Act, which was moving toward a Senate floor vote, positioned HBAR as a potential beneficiary of regulatory clarity alongside XRP and XLM. Analysts cited the bill as a pivotal catalyst for institutional adoption.
HBAR opened June 2026 near $0.090, then suffered a month-long collapse driven by zero ETF inflows from the Canary HBAR ETF, extreme fear sentiment, and broad crypto market weakness, crashing to a 2026 low of $0.0696 by late June and erasing the entire May recovery from the $0.110 spike.
By July 6, HBAR had recovered modestly to approximately $0.079, rebounding from the $0.069 lows, as analysts highlighted HBAR’s enterprise partnerships and Hashgraph technology as long-term strengths. Sentiment remained deeply cautious, with only 13% bullish market signals and the Fear & Greed Index still at extreme fear levels.
HBAR then traded in the $0.065–$0.074 range, moving sideways within a descending channel while holding above key support near $0.0653 and tracking modest broader-market tailwinds.
HBAR continued consolidating between $0.068–$0.070, still trapped in that descending channel since May, with support at $0.065 and little net movement despite steady enterprise-adoption news, including the Asseto Access tokenization platform, and only modest ETF inflows.

