Hedera Price Jumps Toward January Levels as HBAR ETF Inflows and Futures Demand Rise
Key Takeaways
- •HBAR traded near $0.1175, up about 20% in 24 hours, approaching January levels after roughly doubling from its summer low of $0.064.
- •The Canary HBAR ETF has recorded inflows every month since October last year, with cumulative creations exceeding $111.6 million and assets under management above $98 million.
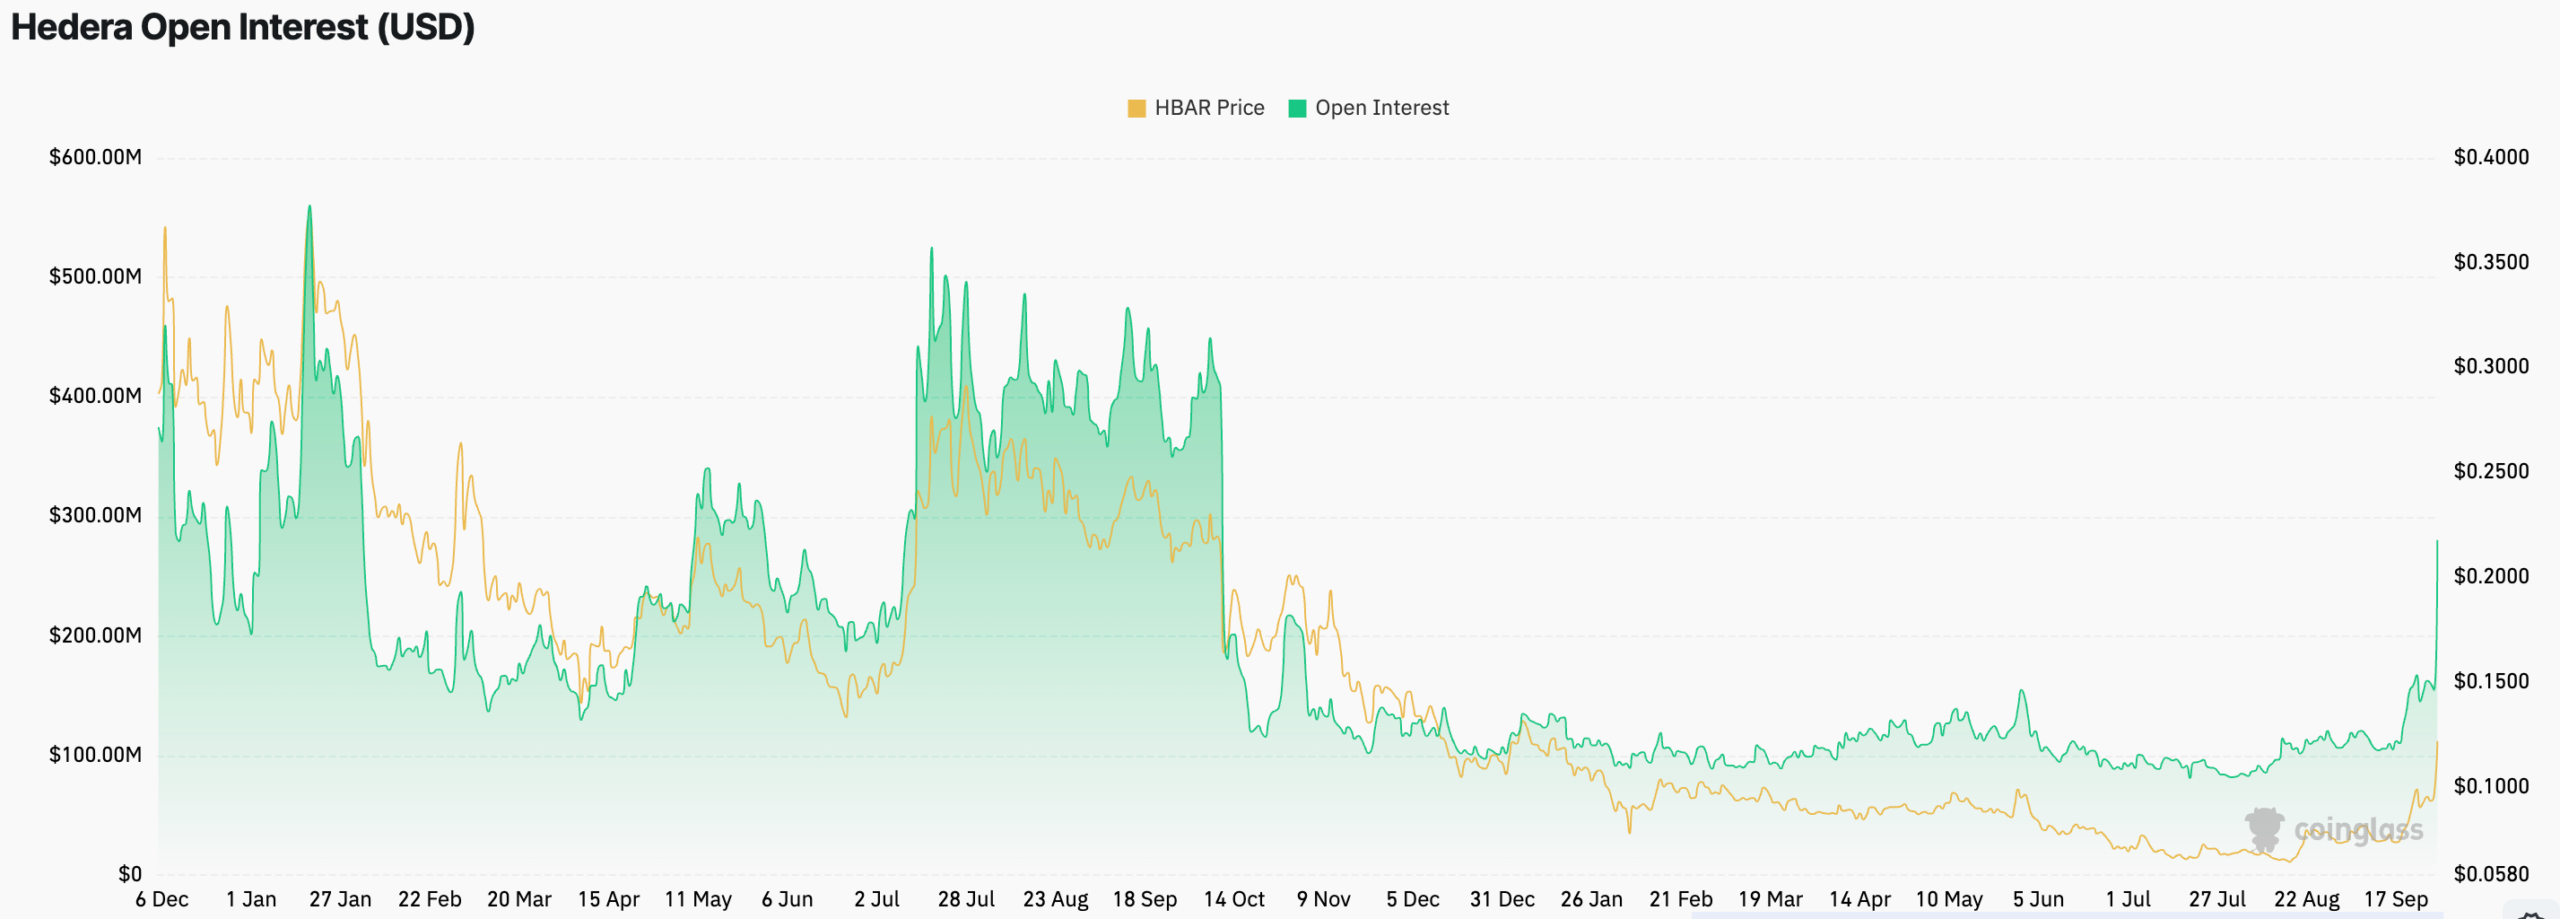
- •Futures open interest climbed above $280 million, its highest level since October last year, while 24-hour spot volume surged 845% to more than $1.37 billion.
- •Hedera's fundamentals improved as total value locked rose to $47.2 million, its highest since June, and governance council members were named to Nvidia's Open Agent Safety Platform alongside firms including IBM and ServiceNow.
- •Technical analysis set a bullish target of $0.1500 for HBAR, an outlook that would be invalidated by a drop below the $0.10 level.
Hedera's HBAR token extended its September rally as it approached levels last seen in January. Data from CoinMarketCap showed the token trading near $0.1175, up about 20% over the past 24 hours, after the latest advance pushed it above $0.12.
The move came after weeks of gains in which HBAR roughly doubled from its summer lows, and it coincided with continued creations in the Canary HBAR ETF as well as a sharp acceleration in derivatives activity. Even so, neither ETF flows nor higher futures open interest, on their own, establishes that the rally will continue.
The rebound has mirrored the performance of Bitcoin and other altcoins. Bitcoin climbed from a low of $57,800 in July to a high of $87,000 this month, and the market capitalization of all coins rose to more than $2.87 trillion. Returning to January levels matters to chart watchers because prior trading ranges often serve as reference points for where supply and demand previously met.
ETF Inflows and Derivatives Demand Rise
The Hedera token's rally has coincided with ongoing ETF accumulation. The Canary HBAR ETF (HBR) has recorded inflows in every month since October last year, adding more than $3.8 million this month after adding $2.57 million the month before.
In total, the fund has taken in cumulative inflows of more than $111.6 million and now holds assets worth over $98 million. The sustained creations suggest that demand for HBAR is rising. Spot ETFs are followed closely for this reason: they let investors gain exposure to a token through standard brokerage accounts without directly holding it, so monthly flow reports are often treated as a barometer of adoption beyond native crypto venues.
The same trend is playing out in the spot market. Hedera's spot volume jumped 845% in the last 24 hours to more than $1.37 billion, a sign that demand has continued to build as the Crypto Fear and Greed Index — a widely cited gauge of overall market sentiment — has remained in the green zone, where readings indicate optimism among traders.
Demand is also rising in the futures market. Open interest climbed to more than $280 million, its highest level since October last year and far above the July low of $82 million. Futures open interest is a widely watched figure that tracks open positions across the market; a higher reading signals that demand and liquidity are increasing, reflecting newly opened positions rather than closed ones.
Fundamentals Improve
HBAR's advance has come as its fundamentals continue to improve. Members of Hedera's governance council were named as part of Nvidia's Open Agent Safety Platform — a development highlighted in a post on Hedera's official X account — with participants including companies such as IBM and ServiceNow. The council-based governance model, in which established enterprises help guide the network, is central to how Hedera positions itself for enterprise use, and placements in cross-industry AI initiatives extend that positioning.
Hedera has also made moves in the AI space. It recently launched a platform that provides independent ordering and timestamps, which can anchor tamper-evident commitments while protecting sensitive data onchain — part of a broader push across the blockchain industry to serve AI-related workloads.
Further data shows Hedera's network is improving. The total value locked (TVL) on the network — a standard measure of assets deposited across its decentralized finance applications — rose to $47.2 million, its highest level since June this year, rebounding from an August low of $15 million — a sign that demand on the network continues to rise.
The network still faces some major challenges, however, including in the stablecoin industry. Data shows that stablecoin market capitalization has dropped to $27 million from a record high of more than $210 million — a reminder that the network's recovery has been uneven across segments even as trading and DeFi activity climb.
Technical Analysis
The daily chart shows the HBAR token has rebounded over the past few weeks. It bottomed out at $0.064, its lowest level in July and August, where it formed a double-bottom pattern, a setup chartists traditionally read as a bullish reversal signal.
Hedera has continued printing a series of higher highs and higher lows, with investors buying every dip. The token has also jumped above the important resistance level of $0.1095, its highest point on May 30, and has held above both the Supertrend indicator and the 100-day Exponential Moving Average (EMA).
The Average Directional Index (ADX) has also jumped to 48, a sign that the uptrend is continuing. Readings above 25 are conventionally used to separate strong trends from sideways conditions.
Based on these signals, the analysis pointed to a bullish forecast, with the next target set at the psychological level of $0.1500. A drop below the psychological level of $0.10 would invalidate that bullish outlook. Alongside those price levels, the flow and onchain metrics above — monthly ETF creations, futures open interest, spot volume, and TVL — are the data points that show whether the current picture is holding.
This article is for informational purposes only and does not constitute financial or investment advice. Technical targets and market scenarios remain conditional.
This article originally appeared on The Marketical.

