HBAR Price Eyes $0.082 Breakout as Analysts Map Higher Targets
Key Takeaways
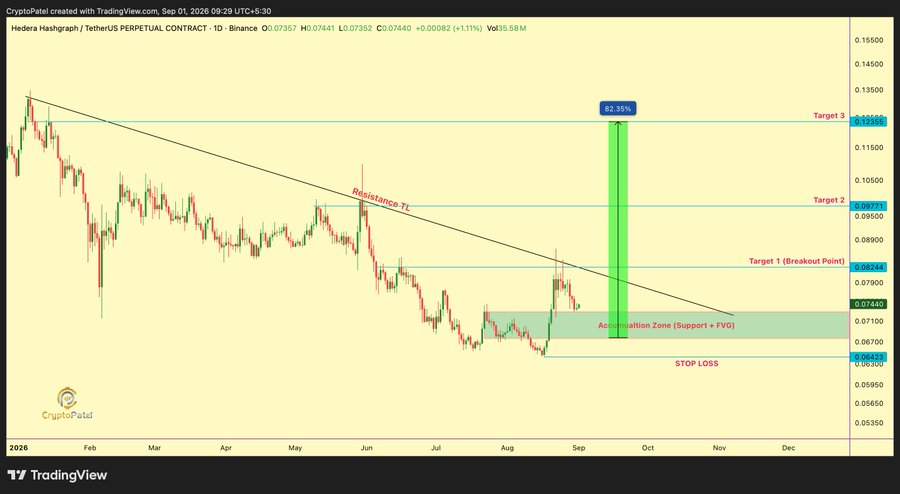
- •Crypto Patel’s setup places HBAR in an accumulation zone between $0.067 and $0.072 with $0.08244 as the main breakout level.
- •A daily close above $0.08244 followed by a retest would confirm the short-term bullish structure, while a move below $0.06423 would invalidate it.
- •The next upside targets in that setup are $0.09771 and $0.12355 if resistance is broken.
- •A separate analysis suggests a possible double-bottom pattern near $0.075, but confirmation would require a breakout above the $0.22 neckline.
- •HBAR was trading near $0.07406 with a market capitalization of about $3.23 billion and active derivatives positioning.
- •The token recently reached about $0.0843 on Aug. 25 before pulling back, leaving the $0.082 to $0.084 range as an important technical barrier.
Key Insights
HBAR price remains inside Crypto Patel’s $0.067–$0.072 accumulation framework, with $0.08244 acting as the key breakout level.
A confirmed daily close above $0.08244 could expose $0.09771 and $0.12355, while a move below $0.06423 would invalidate the setup.
A separate analyst sees a potential double bottom near $0.075, but confirmation requires a much larger move above the $0.22 neckline.
HBAR price is trading near $0.074 as Hedera approaches a descending trendline that has capped several recovery attempts during 2026.
Crypto analyst Crypto Patel identified an accumulation region between $0.067 and $0.072, with $0.08244 serving as the key breakout threshold. His setup requires a daily close above that level and a successful retest before the broader bullish structure gains confirmation. That matters because the current move is still taking place inside a range that has repeatedly drawn in buyers, but the chart has not yet produced the kind of close-and-retest signal traders typically look for before treating resistance as support.
HBAR remains below that resistance after recovering from its mid-August low near $0.0646. The token reached approximately $0.0843 on Aug. 25 before retreating, leaving the $0.082–$0.084 region as an important technical barrier.
HBAR Price Builds Inside an Accumulation Zone
HBAR price has spent recent months trading below a descending trendline that has repeatedly limited upside moves. The latest setup places the token near the upper edge of an accumulation area, where buyers have previously stepped in around the $0.067 to $0.072 range.
CryptoPatel’s setup uses $0.06423 as the stop-loss level and treats $0.08244 as the main breakout point. The analyst said the structure becomes stronger only after a daily close above that resistance, followed by a successful retest. That condition would provide a clearer technical confirmation than an intraday move through the level.
The daily structure shows a recovery from the accumulation zone toward the descending trendline. HBAR price must overcome that line to change the short-term pattern, with the nearby resistance zone also serving as a reference point for whether recent buying pressure can hold through a full daily session.
Breakout Level Sets the HBAR Price Prediction
The first upside target stands at $0.08244, which also serves as the breakout point in the setup. A sustained move above it would place the next target at $0.09771, followed by $0.12355.
The chart also places HBAR below a falling resistance line that extends across the earlier 2026 price action. A daily close above $0.08244 would therefore mark a break from that structure. Without that close and retest, the proposed trend reversal remains unconfirmed.
Buyers would need to defend the accumulation zone while waiting for confirmation above resistance. A failure at the trendline could keep HBAR inside the existing range, which is why the area around the breakout level is drawing close attention in the current technical setup.
HBAR Double-Bottom Pattern Adds Longer-Term Context
A separate daily-chart analysis identifies a potential double-bottom structure near $0.075. That setup uses about $0.22 as the neckline and projects a measured range of $0.34 to $0.39 after a confirmed breakout.
The two technical setups use different timeframes and levels. The shorter-term trendline structure focuses on $0.08244, $0.09771, and $0.12355, while the broader double-bottom analysis requires a move above $0.22.
The double-bottom formation provides broader chart context, while the descending trendline setup focuses on near-term resistance. A move through either confirmation level would strengthen that structure, but each analysis still depends on its own breakout condition rather than on the other pattern alone.
HBAR Crypto Market Data and Key Risk Levels
At the time of writing, HBAR traded near $0.07406, with a market capitalization of about $3.23 billion. Futures volume stood at $66.52 million, spot volume reached $16.09 million, and open interest was about $108.99 million. Circulating supply stood at 43.83 billion HBAR out of a total and maximum supply of 50 billion.
Liquidation data showed $27.45K in positions closed over 24 hours. Shorts accounted for $14.23K, while longs accounted for $13.22K. Over four hours, long liquidations reached $12.53K out of $12.89K. The figures show active positioning as HBAR crypto tests nearby resistance, with traders closing positions during the recent moves.

