Grayscale Calls Bitcoin Prices “Compelling Entry Points,” but Data Shows Limited Token Demand
Key Takeaways
- •Grayscale's head of research Zach Pandl said Bitcoin's roughly 17% November decline to about $64,000 offers compelling entry points for medium- and long-term investors.
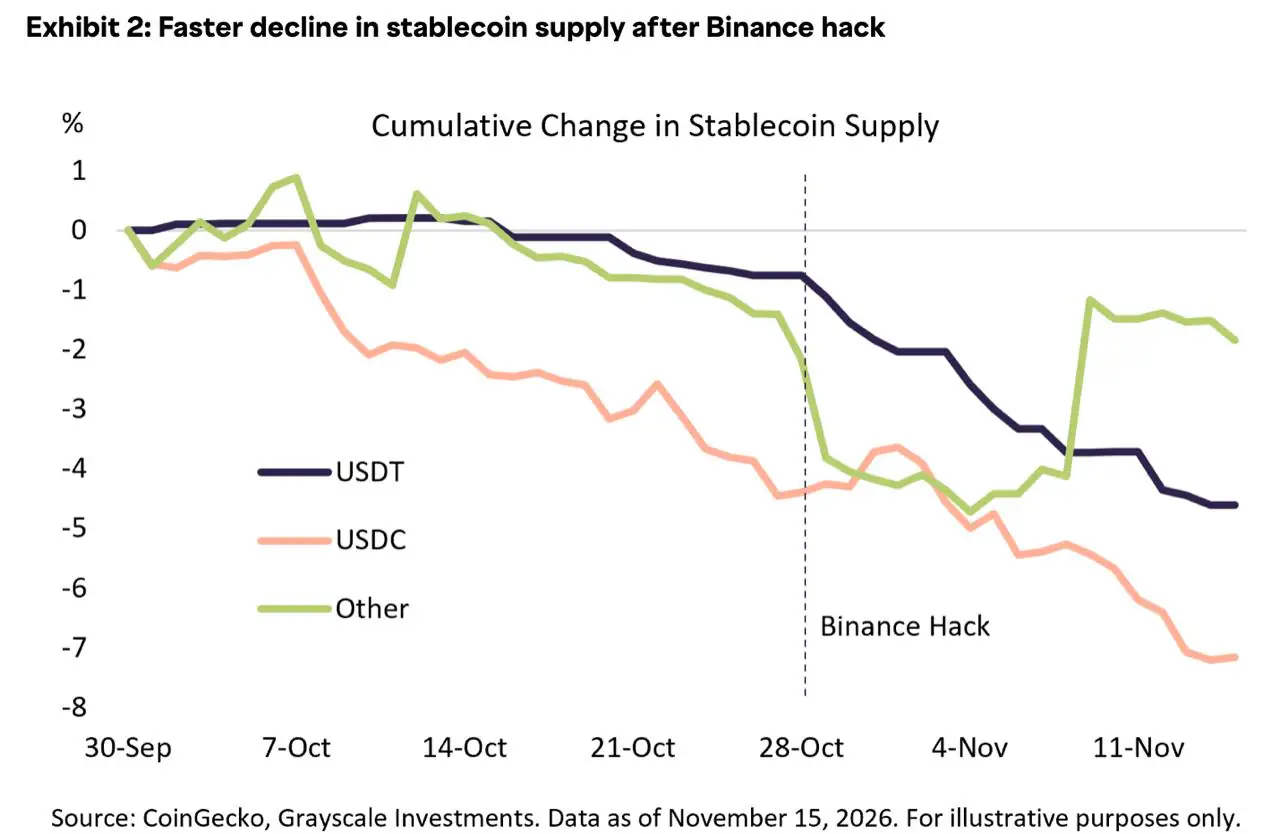
- •Pandl attributed the sell-off primarily to USDC stablecoin outflows that accelerated after the October 29 Binance hack and to spillover selling from AI-related equities.
- •BlackRock's iShares Bitcoin Trust recorded net redemptions of roughly 49.8 million shares, or about 28,000 BTC, over 11 trading days, making the largest Bitcoin fund a net seller during the downturn.
- •USDC circulation fell from about $73 billion on October 8 to $67.9 billion by November 12, confirming net redemptions but not revealing where the dollars went.
- •The live DBS-JPMorgan tokenised deposit service moves bank balances on a permissioned blockchain without touching BTC, ETH or SOL, so it does not generate demand for public crypto assets.
Zach Pandl, head of research at crypto asset manager Grayscale, wrote in a November 16 note that Bitcoin’s roughly 17% decline to about $64,000 during the first two weeks of November created “compelling entry points” for medium- and long-term investors. Over the same period, Grayscale’s market-cap-weighted Crypto Sectors index fell about 18%.
Pandl argued that institutional adoption remains intact. That view coincided with a DBS announcement of a live cross-border service with JPMorgan’s blockchain platform Kinexys, allowing institutions to move tokenised US-dollar deposits—bank balances recorded on blockchain rails—between Singapore and the United States around the clock.
Both developments can be described as institutional crypto adoption, but they involve different forms of demand. The DBS-JPMorgan service moves bank deposits and does not require institutions to buy a crypto asset. November’s data therefore needs to distinguish between bank deposits, stablecoins, network tokens and Bitcoin itself.
Pandl’s diagnosis and what it leaves out
Pandl identified two primary drivers behind the market decline. The first was stablecoin outflows. Supply of USDC, a dollar-pegged stablecoin issued by Circle, began contracting in early October, with the decline accelerating after the October 29 Binance hack. Pandl interpreted the move as investors temporarily withdrawing funds from crypto because of security concerns, rather than losing confidence in regulated stablecoins.
The second driver was spillover from AI equities. Growth portfolios often hold crypto alongside chipmaker Nvidia and other AI-related names, so reducing risk in those portfolios can lead to selling in both areas. Pandl also identified a structural connection: AI and crypto compete for power capacity, while many Bitcoin miners now sell computing capacity to AI firms. Weaker AI investment can therefore affect Bitcoin’s infrastructure layer.
Technical factors added to the pressure. Bitcoin closed below its 200-day moving average on November 12, a long-term trend level that trend-following funds often treat as a sell signal. Falling prices liquidated leveraged perpetual futures positions, and much of the selling occurred over a weekend, when order books are thinner.
Pandl also wrote that outflows from crypto exchange-traded products contributed to the decline but did not appear extreme. His broader fundamentals argument rests on institutional adoption of stablecoins and tokenised assets, along with continued demand for alternative stores of value amid ongoing deficit spending.
Those developments are relevant but do not establish that institutions were buying the assets whose prices fell. A corporate treasurer adopting blockchain settlement is selecting an operating tool, while a fund manager selling Bitcoin is changing a portfolio. The two decisions involve different assets and do not offset each other. A service may use bank deposits, a dollar stablecoin, a network’s native token or Bitcoin, with each arrangement creating a different type of buyer.
Tokenised deposits keep dollars within banks
The DBS announcement links DBS Token Services with Kinexys’s permissioned Blockchain Deposit Account network, while Partior orchestrates settlement. The service handles US dollars only. Ant International is its first client and uses it for real-time treasury management across entities in Singapore and the United States.
Transfers between the blockchain accounts and conventional demand deposit accounts still pause for three hours on Saturday afternoons. The banks said they are working to remove that interruption. The service is described in the DBS announcement.
Every balance in the system is a deposit liability of DBS or JPMorgan. No part of the process touches BTC, ETH or SOL, and no fee is paid in a public token. A framework announced by the banks in November 2025 did envisage JPMorgan deposit tokens on Base, a public Ethereum layer-2 network, which would have routed some settlement through a public blockchain. The live service announced a year later instead operates on the permissioned network.
This is the type of adoption Pandl cited as a favorable trend, and the development is real. For holders of public crypto assets, however, its direct value is limited: it normalizes blockchain settlement within regulated banking without creating a buyer for the tokens those holders own. Coindoo previously reported on the JPMorgan-DBS tokenized dollar transfer launch.
Public-chain usage does not equal substantial token demand
Public networks differ because usage must be paid for in the network’s native asset. According to Solana’s fee documentation, the base fee is 5,000 lamports per signature, or 0.000005 SOL; a lamport is the smallest unit of SOL. Half of the fee is burned and half is paid to the validator.
With SOL trading in the low $80s on November 12, the base fee was worth about four hundredths of a cent. A $10 million USDC transfer requiring one signature would cost the sender a fraction of a cent in SOL, plus any priority fee selected by the sender.
The mechanism required by Pandl’s argument therefore exists on public chains, but its scale depends on transaction count and congestion rather than the dollar value transferred. Circle reported $13.9 trillion in on-chain USDC volume during the third quarter. Almost none of that value needed to be converted into a network token to move.
Transaction value, transaction count and fee expenditure are separate measurements. Only fee expenditure directly represents demand for the network’s native coin.
IBIT share data shows Bitcoin-fund redemptions
Bitcoin does not have a comparable fee mechanism. Its investment case in this context is based on scarcity and store-of-value allocation, making changes in BTC holdings the relevant evidence.
A physically backed fund such as BlackRock’s iShares Bitcoin Trust (IBIT) provides a direct measure if the correct data is used. Trading an IBIT share on Nasdaq does not move Bitcoin; only the creation or redemption of share baskets changes the trust’s holdings.
The trust’s third-quarter 10-Q, filed with the SEC, reported 1,434,080,000 shares outstanding on October 31. The iShares product page showed 1,384,280,000 shares on November 16. Each 40,000-share basket was backed by 22.64 BTC.
The difference represents a net redemption of about 49.8 million shares, or roughly 28,000 BTC leaving the trust over 11 trading days. That amounted to about 3.5% of the fund.
Bitcoin’s price fell 17% while the fund’s holdings declined 3.5%. The world’s largest Bitcoin fund was therefore a net seller, contradicting the idea that institutions were broadly buying the dip through ETFs. The sales were not large enough to explain the entire market move, however.
The figures support Pandl’s view that the marginal seller was in leveraged futures and spot markets rather than primarily in the ETF wrapper. They also show that the institutional adoption cited in his thesis—stablecoins and tokenised deposits—produced no measurable Bitcoin purchases during the period under review.
USDC contraction confirms redemptions, not their destination
Circle’s transparency page reports issuance, redemptions and circulation separately, allowing Pandl’s first explanation to be tested.
USDC circulation was approximately $73 billion on October 8, $70 billion on October 29 and $67.9 billion on November 12. The decline represented roughly a 7% contraction over five weeks, with the pace increasing after the Binance incident. That matched the pattern Pandl described. Circle’s third-quarter average was $73.3 billion, leaving the November figure well below the quarter’s average level.
The data confirms net redemption: more USDC was returned to Circle for dollars than was newly issued. It does not show where the redeemed dollars went. A redemption caused by an exchange treasury reallocating funds toward USDT would look the same on Circle’s data as a redemption by an investor leaving crypto.
Pandl’s interpretation that the move reflected an off-ramp is consistent with the figures but not proven by them. Coindoo’s reporting on dip-buying alongside dollar withdrawals shows that the two activities can occur at the same time.
It would be incorrect to add the USDC contraction to ETF outflows and declining exchange balances and describe the total as capital leaving crypto. The three data series overlap. An investor who redeems USDC and uses the dollars to buy IBIT shares from another holder appears as a stablecoin outflow but not necessarily as an ETF outflow. Each measure answers a different question and should be considered alongside the others rather than summed.
Data points that would support or weaken the entry-point case
The entry-point case would be supported if IBIT shares outstanding returned above 1.43 billion, the October 31 level, before the trust’s year-end report.
It would also be supported if USDC circulation recovered to $70 billion on Circle’s weekly page by mid-December, with issuance exceeding redemptions.
The case would be weakened by a second consecutive month of net IBIT redemptions while bank-tokenisation announcements continued. That combination would show that adoption and demand for publicly traded crypto assets remained decoupled.
What could make Grayscale’s case stronger
Pandl’s note addressed medium- and long-term investors and did not claim that the market had reached a bottom. The stronger version of his argument would be one in which adoption reached the assets being purchased: net fund creations that rebuilt holdings, sustained public-chain usage with fee demand large enough to matter, and USDC issuance.
Figures cited are as of the dates stated and are drawn from Grayscale, DBS, SEC filings, iShares, Circle and Solana documentation. They may have changed since publication. Crypto assets are volatile, and investors may lose some or all of their capital. This article is for informational purposes only and does not constitute investment, financial or trading advice.

