Google DeepMind and Partners Release ForTy, a Global 10-Meter Map Classifying Natural, Planted, and Farmed Forests
Key Takeaways
- •Google DeepMind, Google Research, WRI, and IIASA released Forest Typology (ForTy) 2020, a global map that classifies all land at 10-meter resolution into six forest and land-use types aligned with FAO definitions.
- •The map is positioned as a key baseline for the EU Deforestation Regulation, which requires companies to verify that commodities like coffee, cocoa, palm oil, rubber, and soya do not come from forest land converted to agriculture.
- •An accompanying early-release time series tracks forest changes each year from 2017 to 2025, exposing hidden conversions such as natural forest being replaced by plantations that standard tree-cover maps often miss.
- •The ForTy model was trained on about 1.7 million labeled locations and validated against more than 9,000 randomly selected sites, correctly identifying forest type 90% of the time and distinguishing forest from non-forest 95% of the time.
- •The ForTy 2020 map and time series are freely accessible on Google Earth Engine and Figshare under an open license, with the underlying research published in the journal Scientific Data.
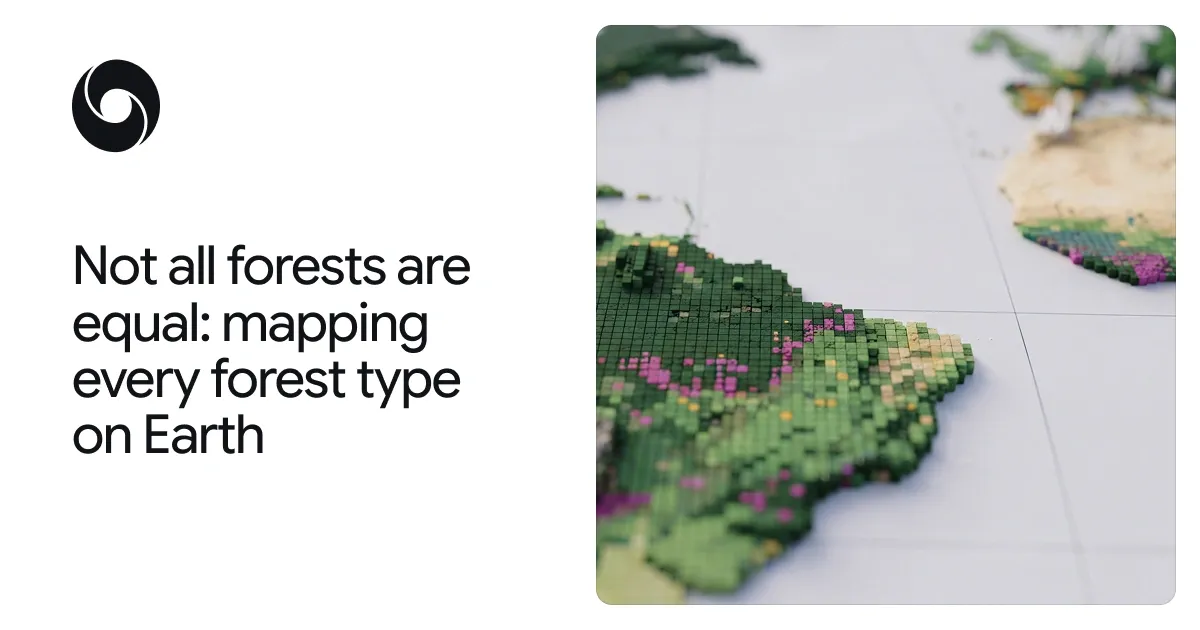
Google DeepMind and Google Research, in collaboration with the World Resources Institute (WRI) and the International Institute for Applied Systems Analysis (IIASA), have released Forest Typology (ForTy) 2020, a global map that categorizes every 10-by-10-meter patch of land on Earth into six distinct forest and land-use types. The organizations describe the release as a key baseline for the European Union's deforestation regulation. Alongside the map, the team is sharing an early time series that tracks how forests changed each year from 2017 to 2025, including where natural forests were replaced by plantations or farms.
The announcement, published on the Google DeepMind blog by researchers Maxim Neumann and Charlotte Stanton, states that users can now see at 10-meter detail worldwide, year by year, not just where forest was lost, but what replaced it: a timber plantation, a tree-crop farm, or other land.
Why "Tree Cover" Isn't Enough
From space, an old-growth rainforest, a eucalyptus plantation, and an oil palm estate can look like the same patch green. They hold very different amounts of carbon and biodiversity, however. According to the post, all forests store carbon and, together, forests are home to most of the world's land-based plant and animal species. But a forest's ecological value also depends on its history: a primary forest that has never been cleared holds far more carbon and biodiversity than a single-species timber plantation that is harvested every decade or two.
Most global maps only indicate whether trees are present, which creates a challenge for those trying to protect natural forests. The European Union's regulation on deforestation-free products (EUDR), for example, requires that products like coffee, cocoa, or palm oil do not originate from land that was forest in 2020 and has since been converted to agriculture. Its scope extends to rubber, soya, cattle, and derived products as well. Wood products, such as furniture, must also be free of forest degradation: they cannot come from primary forests that have since been converted into plantation or planted forests, or from naturally regenerating forests that have since been converted into plantation forests. As a result, companies and regulators need to know not just where trees are, but what kind of forest they form — primary or regrowing, planted or plantation, forest or farm — and what replaces that forest after a harvest.
The same group previously released Natural Forests of the World 2020, a 10-meter resolution global map that separated natural forests from all other tree cover. That release offered a starting point to help companies and regulators implement the EU Deforestation Regulation, and to support commodity producers in meeting their commitments not to convert natural forest. It answered one question for every patch of land: was it natural forest in 2020 or not? ForTy goes further, showing what kind of forest is there, from primary forest to timber plantation to tree crops, and, with the new time series, how that changes each year.
How ForTy Classifies the World's Forests
ForTy sorts land into six categories based on definitions from the UN Food and Agriculture Organization (FAO):
- Primary forest: native forest with no visible signs of human disturbance.
- Naturally regenerating forest: forest that grew back on its own, for example after logging or fire.
- Planted forest: forest that people planted or seeded, and managed over long cycles.
- Plantation forest: fast-growing, intensively managed tree farms, often of one species.
- Tree crops and agroforestry: farms that grow things other than wood, like oil palm, rubber, cocoa, or fruit.
- Other land: everything else, from grassland and cropland to cities and water.
FAO applies these same definitions in its Global Forest Resources Assessment, the periodic assessment through which countries report the state of their forests, so the map's categories match the vocabulary already used in international forest reporting.
In the Forest Typology 2020 map, each color shows the most common forest or land type in each square kilometer, and users can explore it at 10-meter detail in the Earth Engine app.
Training the ForTy model was challenging because these categories depend in part on how land is used, not just how it looks. To teach the model the difference, the team built a large-scale collection of forest-type examples with about 1.7 million labeled locations drawn from expert surveys, national and regional datasets, and targeted reviews of places where the model struggled. The model uses a custom architecture designed for the challenges of remote sensing data and takes as a key input AlphaEarth Foundations embeddings — data-compact summaries of years of satellite observations for each 10-meter pixel — so it can spot subtle clues like planting patterns, growth cycles, and harvest rhythms.
From above, the five forest and tree-crop classes can look alike. ForTy is able to identify the subtle differences in structure and seasonal patterns that set them apart, accurately categorizing them in a global map database. Imagery for the project is credited to Google Earth, Maxar Technologies, and Airbus.
Putting the Map to the Test
A map is only useful if people can trust it. With IIASA and WRI, the team validated ForTy against more than 9,000 randomly chosen sites around the world. At each site, two trained experts studied high-resolution imagery and years of satellite records to determine which type of land was really there. ForTy picked the right forest type 90% of the time, and told forest apart from non-forest land 95% of the time, outperforming other global forest maps.
Beyond accuracy, the team notes that global conservation is not one-size-fits-all. Instead of giving a yes-or-no label for a specific patch of land, ForTy provides a probability score for each class, enabling users to adapt the classification to regional contexts and application-specific precision trade-offs. A company assessing deforestation risk under EUDR might set a strict threshold, only accepting pixels the model is highly certain about to avoid regulatory risks. A researcher estimating total forest extent, meanwhile, might use the full spectrum of probabilities to get a fuller picture of the potential landscape.
From a Single Snapshot to a Story of Change
A map of a single year is a useful baseline, but forests change. The new early-release time series applies a similar approach to every year from 2017 to 2025. It shows not only where forests disappear and where they grow back, but also what kind of change happened: a natural forest turned into a timber plantation, for example, or abandoned land slowly regenerating into forest.
This differentiation matters because some of the most important changes are hard to see from space. When a natural forest is logged and replanted as a plantation, the land soon looks green again, so standard tree-cover maps might not pick up the change. ForTy's time series makes these hidden changes visible, both losses and gains, and can be explored in a separate Earth Engine app.
Availability and What's Next
The Forest Typology 2020 map, described in a paper in Scientific Data, a peer-reviewed open-access journal in the Nature Portfolio, and the new time series are now freely available on Google Earth Engine, Google's cloud platform for geospatial analysis, under an open license; the dataset is also published on Figshare. The team hopes governments, companies, conservation groups, and scientists will use them to help build deforestation-free supply chains, direct forest finance where it is needed, and protect the natural forests that matter most. Over the coming months, the team says it will keep improving the time series with partners and users.
ForTy is part of Google's AI for Nature research portfolio, which includes mapping the drivers of forest loss, forecasting deforestation risk, modelling global species distributions, and monitoring biodiversity in the field. ForTy is also the latest addition to Google Earth AI, Google's collection of geospatial models and datasets designed to help tackle the planet's most critical environmental challenges.
Acknowledgements
The work was co-developed by Google DeepMind and Google Research, with the World Resources Institute and the International Institute for Applied Systems Analysis. The post's co-authors are Anton Raichuk, Peter Potapov, Myroslava Lesiv, Matthew Overlan, Mélanie Rey, Ravindran Rajakumar, Michelangelo Conserva, Radost Stanimirova, Michelle Sims, Sarah Carter, Elizabeth Goldman, Yuchang Jiang, Linus Scheibenreif, Ivelina Georgieva, Maria Shchepashchenko, Steffen Fritz, Nicholas Clinton, Dan Morris, and Drew Purves, along with trusted testers who helped improve the map.

