Gold Finds Its 4000 Floor as July Payrolls Shrink, Yen Intervention Supports Rally
Key Takeaways
- •Gold settled at 4,401 on Friday with a 7.4% weekly gain, its second-best performance of the year, driven by contracting July Non-Farm Payrolls and coordinated yen intervention totaling over $90 billion.
- •July payrolls shrank contrary to consensus expectations of growth, shifting market sentiment toward potential Federal Reserve rate cuts and lifting gold's appeal as a non-yielding asset.
- •Gold crossed above its smooth valuation line for the first time in 100 trading days, and the author's trend consistency indicators generated buy signals that have produced gains of 5% for gold and 7% for silver since early July.
- •Short positions in gold and silver showed signs of capitulation as prices clearly departed the lower trading ranges that had constrained them for weeks.
- •The Shiller CAPE ratio surpassed the deMeadville P/E for the first time since 2013, while broader economic indicators including employment, construction spending, and the Economic Barometer all weakened.
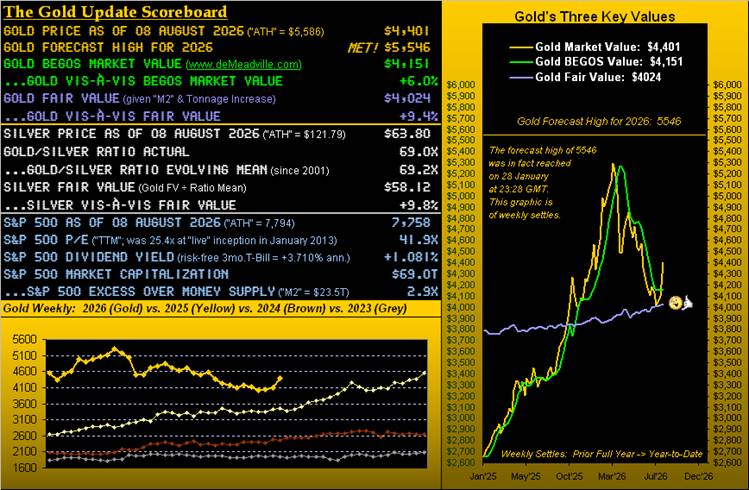
Gold posted its second-best weekly performance of the year, settling Friday at 4,401 for a +7.4% gain — the strongest since the +8.3% advance recorded for the week ending January 23. The rally was catalyzed by weaker-than-expected US July Non-Farm Payrolls data and currency intervention efforts supporting the Japanese yen.
The Payrolls Catalyst
On Friday at precisely 12:30 GMT, the US released July's Non-Farm Payrolls report — historically referred to as "The Mother of All Numbers." Within the 60 seconds following the release (12:30–12:31 GMT), gold moved from a low of 4,371 to a high of 4,418, a swing of +47 points or +1.1%.
The immediate market reaction suggested that payrolls had contracted rather than increased as consensus expected. The data subsequently confirmed that July payrolls had indeed shrunk. A contracting labor market directly bears on the Federal Reserve's dual mandate of maximum employment and stable prices; softer employment data typically shifts expectations toward monetary easing, and gold, as a non-yielding asset, historically benefits when rate-cut expectations rise because lower real rates reduce the opportunity cost of holding it.
Yen Intervention Provides Additional Support
Gold also benefited from currency market developments. The previous Friday, the New York Fed conducted a direct swap of €26 billion for yen, while Japan's Finance Ministry deployed approximately $90 billion purchasing its own currency. Coordinated interventions of this scale are uncommon — Japan's last confirmed solo intervention occurred in 2022 — and they signal official concern about excessive currency depreciation that can disrupt trade balances and import costs. While the yen settled slightly below Monday's open during the past week, it remained well above the prior Friday's levels. The conventional interpretation — a weaker dollar supporting higher gold — materialized, although the author notes that over many years of analysis, gold demonstrates no consistent currency preference.
The 4000 Level as a Floor
Two weeks prior, the author had identified the 4,000 area as a potential floor for gold, only to note last week that gold had resumed declining. The combination of yen intervention and the July payrolls contraction reversed that slide. Gold has now posted 21 weeks of parabolic short trend — the longest such stretch since May 2013.
At 4,401, gold needs to advance just +33 points to eclipse the 4,434 "flip-to-Long" level. The expected daily trading range currently stands at 98 points, with the weekly range at 235 points.
Technical Indicators Turn Positive
With the 4,000 floor essentially holding, the author's "Baby Blues" trend consistency indicators rose sufficiently to rotate negative regression trends back to positive — ending a 66-trading-day negative streak for gold and a 46-trading-day negative streak for silver.
The "Baby Blues" crossed above the key -80% axis, generating "BUY" signals effective from silver's July 1 close at 59.61 and gold's July 2 close at 4,136. From those signals to the current date, gold is up +5.0% and silver up +7.0%, even after subtracting approximately +60 points of fresh December gold contract premium.
Gold Crosses Above Valuation Line
Gold crossed above its smooth valuation line for the first time since March 11. The period below Market Value lasted exactly 100 trading days — a record to date, exceeding even the 88-day above-Market Value record achieved in the prior year.
At 4,401, gold is +6.0% above its BEGOS Market Value and +9.4% above Fair Value. The author notes that when gold breaks above its smooth valuation line, it historically constitutes a buy signal in its own right.
Shorts Retreat as Prices Depart Lower Ranges
Following the week's rallies, short positions showed signs of capitulation. The respective 10-day Market Profiles for gold and silver indicate that prices have clearly departed the lower trading ranges from which they had been unable to break free for weeks.
Economic Barometer: Weak Data Across the Board
The Economic Barometer continued its downward drift. Key findings from the week:
- Q2 Preliminary Productivity nearly doubled from +0.8% in Q1 to +1.4%. However, productivity tends to rise as the human workforce contracts.
- July Payrolls shrank, contrary to consensus expectations.
- ADP July employment data came in at less than half the gain reported for June.
- Construction Spending contracted in July, missing estimates, with June figures revised lower.
Meanwhile, the S&P 500 reached an all-time high. The divergence between softening labor-market indicators and record equity levels underscores a recurring theme of the post-pandemic period: stock valuations have been propelled by factors including strong corporate margins and technology-sector concentration even as broader macroeconomic indicators flash caution.
Shiller CAPE Surpasses deMeadville P/E
Robert Shiller's Cyclically Adjusted Price/Earnings (CAPE) ratio surpassed the deMeadville "live" P/E for the first time since the latter's debut in 2013. The CAPE, developed by Nobel laureate Shiller, compares current stock prices to average inflation-adjusted earnings over the trailing ten years, offering a longer-horizon valuation lens than standard trailing P/E measures. The deMeadville P/E, Shiller's CAPE, and the P/E compiled by S&P/DJI itself are tracked monthly. The S&P/DJI measure remains comparably lower but still sits at double the "acceptable maximum" taught in portfolio theory.
The author quips: "Earnings don't matter anymore" — until they again do.
Gold, the author concludes, always matters, regardless of a 4,000 floor or higher.
Source: GoldSeek | TheGoldUpdate.com | deMeadville.com | Follow on X: @deMeadvillePro
By Mark Mead Baillie, who has over two decades of experience in banking and financial services, including roles at Banque Nationale de Paris, Barclays Bank, and Société Générale. He is the founder of de Meadville International and the author of "The Gold Update."

