Gold Stocks Break Out as GDXJ Leads the Move
Key Takeaways
- •GDXJ surged 7.4% on Wednesday, ranking in the top 1% of all its trading days ever, while gold rose 4.1% to $4,245 with no identifiable catalyst.
- •Both gold and gold stocks broke decisively out of multi-month falling wedge chart patterns, which technical analysts view as bullish reversal formations that often precede sharp upside moves.
- •GDXJ had fallen 41.3% over 4.7 months prior to the breakout, reaching its most oversold level relative to its 200-day moving average in 3.7 years.
- •GDXJ's 25 largest mining components averaged all-in sustaining costs of $1,436 per ounce in Q1 2026 against a record average gold price of $4,873, producing implied profits of $3,437 per ounce with 71% margins.
- •The author identifies this breakout as a buy signal, noting that mid-tier and junior gold miners have historically amplified gold price movements by three to four times or more.
Gold Stocks Break Out as GDXJ Leads the Move
Adam Hamilton
Gold stocks surged to a major technical breakout, mirroring and amplifying gains in the metal itself. Like gold, the leading miners' ETFs had spent months tightening inside a bullish chart pattern known as a falling wedge. Such formations typically resolve with sharp reversals and upside breakouts, often signaling the resumption of bull markets. That appears to be the case now, as gold miners' technicals, sentiment, and fundamentals all point to substantially higher stock prices.
There are only 17 gold-stock ETFs trading in the US, a surprisingly small number given this sector's long history of outperformance and the huge growth in exchange-traded funds. By comparison, SpaceX, which went public in mid-June, already has 25 single-stock ETFs dedicated to it. Of the gold-stock ETFs, only two really matter: VanEck's GDX and GDXJ.
GDX, which is dominated by large major gold miners, was first launched in mid-May 2006. Its $25.4 billion in net assets midweek represented nearly two-thirds of the total capital in all US gold-stock ETFs. GDXJ followed in mid-November 2009 as a junior-gold-stock ETF, though it later became heavily weighted toward mid-tier gold miners—a shift reinforced by VanEck's 2017 fund reconstitution, which capped individual position sizes after GDXJ's assets had grown too large relative to the investable junior-miner universe. Midweek, GDXJ accounted for another one-fifth of gold-stock ETF capital.
GDX and GDXJ have never surrendered their first-mover advantages and now together command more than five-sixths of all capital American investors have deployed in gold-stock ETFs. The only other gold-stock ETF worth mentioning is iShares' RING, a distant third at roughly one-eighteenth of the total. Most analysts, including me, focus on GDX for obvious reasons, but GDXJ has historically tended to outperform its larger sibling.
Smaller mid-tier and junior gold miners are fundamentally superior to the majors in several ways. They usually operate smaller portfolios of one to four mines, so expansions or new mine builds can have a much larger effect on production. That makes them better able to offset depletion and grow consistently. Their mines also tend to be lower-cost and more profitable, and their smaller market capitalizations make their stocks easier to bid higher.
For more than a quarter-century, I've specialized in trading smaller mid-tier and junior gold stocks and writing financial newsletters analyzing gold, which overwhelmingly drives miners' fortunes. When I saw gold and gold stocks jump on Wednesday and shatter their falling wedges, I knew I had to write about these breakouts. Instead of viewing them through the GDX lens like most analysts, I am using GDXJ today.
GDXJ clearly outperforms GDX, with the mid-tiers and juniors amplifying gold more than the majors. While the numbers here are larger than GDX's, the analysis also applies to GDX. Gold stocks' midweek surge and breakout were strongly bullish technical developments that point to much larger gains ahead. In last week's essay on gold's bullish falling wedge, I predicted a major breakout before it occurred.
In technical analysis, falling wedges are bullish reversal patterns defined by downward-sloping converging trendlines. Their upper resistance declines faster than their lower support, creating lower highs and lower lows. The lower highs reflect increasing technical damage and growing bearishness, which erodes traders' willingness to buy after larger and longer drawdowns. That should sound familiar.
At the same time, the much slower retreat in lower lows on declining volume as a falling wedge matures shows that selling pressure is fading. Early in major selloffs, many more traders still have capital at risk and rush to exit as prices fall. That front-loads the selling. Later, there is less selling force left, so the pressure gradually weakens and eventually runs out.
Eventually, as the resistance and support lines of a falling wedge near convergence, buyers regain the upper hand over dwindling sellers, fueling upside breakouts. Short-covering can also play a role when moves are as violent as Wednesday's in gold stocks. These breakouts also quickly shift bearish psychology, with traders noticing the move and returning to chase the new upside momentum.
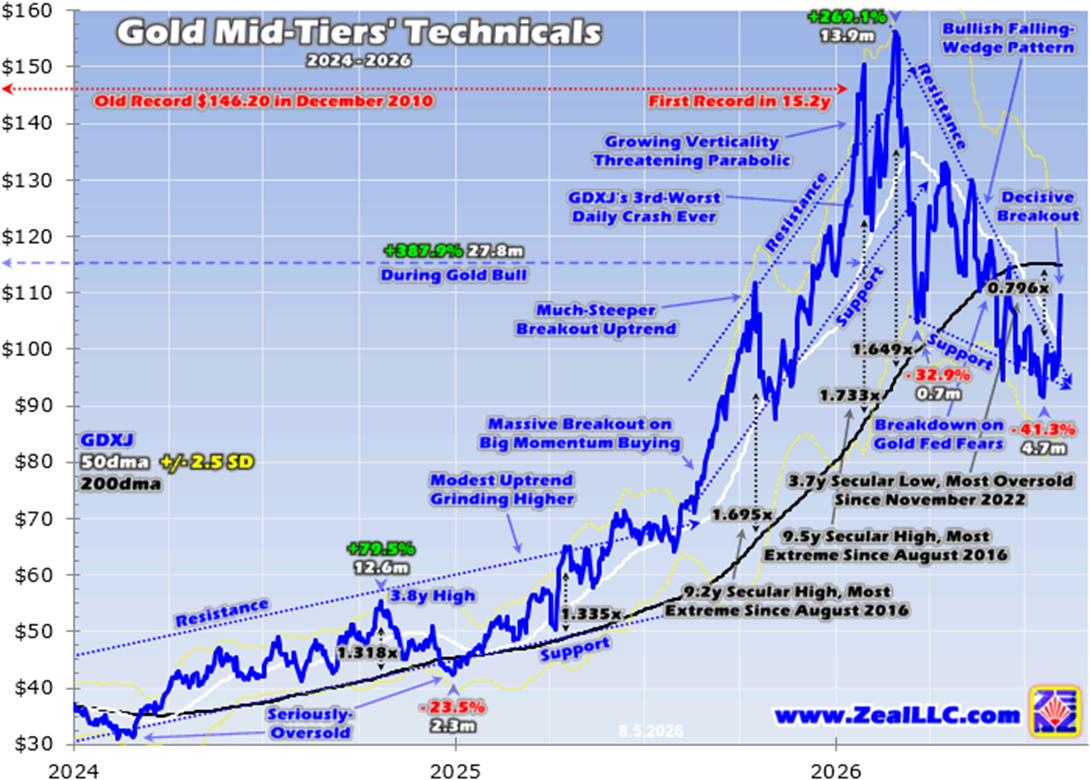
That is exactly what happened in gold stocks. The recent GDXJ chart clearly shows a decisive upside breakout from a massive falling wedge this year that developed after a huge gold-stock bull run became nearly parabolic. It is a textbook-perfect resolution, and it is unfolding exactly as expected. If you have been waiting for a gold-stock buy signal after this year's carnage, this is it.
Gold stocks are ultimately leveraged plays on the metal they mine, which overwhelmingly drives their profits and, in turn, their stock prices. From early October 2023 to late January 2026, gold surged 196.4% in its biggest cyclical bull market ever in dollar terms. Over that extraordinary 27.8-month span, GDXJ rose 387.9%, which actually lagged. That near-quintupling only amplified gold's gains by 2.0 times.
The majors in GDX normally leverage meaningful gold moves by 2x to 3x, while the mid-tiers and juniors are closer to 3x to 4x or more. That leverage stems from mining's capital-intensive, high-fixed-cost structure: when gold prices climb, incremental revenue flows disproportionately to the bottom line, expanding margins far faster than operating costs. Gold stocks have lagged gold's monster record bull market in recent years for reasons beyond the scope of this essay. But because they were still far from fully reflecting gold even at their highs, the sector still has substantial upside potential, and this breakout should begin unlocking it.
GDXJ's previous record close of $146.20, which held for 15.2 years, dated back to early December 2010. It was not exceeded until the day before GDXJ initially peaked in late January 2026 at $150.42. GDXJ then plunged with gold on the final trading day of January, and its 13.6% crash ranked as its third-worst day ever. Over the next month, smaller gold miners rebounded to an even higher high of $156.19.
Then Trump inexplicably launched his ill-fated war with Iran, which led to gold's backward war trade and a serious drawdown from its popular, speculative, mania-like peak. But consider the fundamental implications of GDXJ barely reaching new record highs 15 years later in Q1 2026. In mid-May I wrote an essay on the GDXJ top 25 mid-tiers' Q1 2026 results, which proved to be by far their most profitable quarter ever.
GDXJ's 25 largest components averaged all-in sustaining costs—the industry-standard metric adopted by the World Gold Council in 2013 that captures direct mining expenses plus sustaining capital expenditures, exploration, and corporate overhead—of $1,436 per ounce in Q1, well below the record average gold price of $4,873. That produced epic implied unit profits of $3,437 per ounce for the smaller mid-tier and junior gold miners. Yet GDXJ was still trading around the same levels it had seen in late 2010. Gold averaged only $1,370 in Q4 2010, and miners were earning dramatically less then.
For 40 quarters in a row, I have been painstakingly analyzing the latest financial and operational results of both the GDX top 25 and GDXJ top 25 gold miners after each earnings season. I have already started work on brand-new Q2 2026 results, which are set to prove this sector's second-best ever. Once they are all released, I will share the analyses in new essays over the next couple of weeks. Earnings seasons are fascinating.
My deep research into gold miners' quarterly results only goes back to Q2 2016, long after GDXJ's record close in December 2010. All-in sustaining costs were not introduced until June 2013. Even the leading AI LLMs could not give me consistent, credible answers to variations of the question, "What were the GDXJ gold miners' average cash costs in Q4 2010?" Tracking that down manually may not be possible.
It would require identifying GDXJ's composition that far back, then painstakingly digging through 10-K and 10-Q reports and the equivalents from other countries, many of which may no longer be easily available online after years of mergers. But if one were to hazard a guess, the Q4 2010 equivalent of AISCs was probably at most half of prevailing gold prices. That would imply smaller gold miners earned about $685 per ounce, or 50% profit margins.
Fast-forward to Q1 2026, and the GDXJ top 25 again earned a record $3,437 per ounce, for extremely fat 71% profit margins. Yet GDXJ's average close in Q1 2026 of $156.19 was only 22.2% above Q4 2010's $127.84, despite the radically higher earnings. The takeaway for GDXJ's big falling-wedge breakout is that fundamentals continue to support much higher stock prices. Gold stocks' bull market is far from mature.
After gold's monster record cyclical bull pushed it to the most overbought levels in a staggering 45.9 years, a serious reckoning was needed to rebalance technicals and sentiment. As I warned in early February, gold's next ten largest cyclical bulls in dollar terms averaged subsequent drawdowns of 20.8% in just 2.1 months. As usual, gold miners' stocks were expected to leverage any meaningful decline in the metal.
Gold initially plunged a very similar 18.6% in 1.8 months into late March, and GDXJ amplified that with an ugly 32.9% drop in just 0.7 months. Remember that because gold stocks had not fully reflected gold's bull market, they continued rallying for another month after the metal's near-parabolic peak. Gold's drawdown later extended to 26.3% over 5.5 months by mid-July, worsened by irrational fears of Fed rate hikes, and GDXJ fell even further.
By mid-July, GDXJ had dropped as low as $91.66 on a closing basis, extending smaller gold miners' total selloff to a brutal 41.3% over 4.7 months. That pushed GDXJ down to just 79.6% of its baseline 200-day moving average, making it the most oversold this leading sector metric had been in 3.7 years, since early November 2022. That date was nearly a year before gold's monster record bull began, a serious secular low.
Back in late January, as gold threatened to go parabolic, GDXJ had skyrocketed to 73.3% above its 200-day moving average. That was the most extreme overbought close for the mid-tiers and juniors since early August 2016, a span of 9.5 years. The subsequent correction inside this massive falling wedge therefore reversed smaller gold stocks from nearly decade-high overbought levels to nearly four-year-worst oversold levels.
That huge reversal naturally crushed herd sentiment, which collapsed from wild bullishness in late January to universal bearishness by mid-July. As smaller gold stocks lost more than two-fifths of their value in less than five months, speculators and investors increasingly fled. That combination of fear and apathy is ideal for a major bottom, which supports the case for this falling-wedge breakout.
As I concluded last week about gold's parallel falling wedge: "...chart pattern alone isn't enough to compel aggressive buying. Yet supported by bullish sentiment, technicals, and fundamentals, it adds to the case gold's next major upleg will soon be underway. The more bullish factors aligning after a long and deep selloff, the greater the odds it will soon reverse." That had very bullish implications for gold stocks.
My final sentence was, "As gold's falling wedge yields to a decisive persistent rally, battered gold stocks will soar." Then on Wednesday gold jumped 4.1% to $4,245 with no apparent catalyst. Some analysts pointed to a modest miss in that morning's ADP report on US private-sector jobs, but the timing does not fit. Nearly four-fifths of gold's gains that day had already occurred overnight before the ADP release.
Afterward, gold actually pulled back from about $4,210 before ADP to $4,190 forty-five minutes later. War news was probably not the driver either. Iran and Oman were negotiating to reopen the Strait of Hormuz under Iran's full control with tolls, which the US strongly opposes. So it was not as if some major agreement had just been reached. Wednesday was not a risk-on day either, with the S&P 500 slipping 0.2% while gold soared.
Heavy overnight buying emerged despite no obvious catalyst, and gold's falling-wedge breakout likely encouraged technically oriented gold-futures traders to chase the move. As gold surged into the US trading day, gold stocks followed, amplifying the move with a huge 7.4% gain in GDXJ. That ranked in the top 1% of all GDXJ days ever, making it highly significant. It was a very decisive falling-wedge breakout.
I define decisive as at least 1% beyond a technical trendline. As the chart shows, gold stocks' falling wedge had tightened so much that the upper resistance and lower support lines were nearly converged. If GDXJ had only barely moved above resistance, the breakout would not have been decisive and few would have noticed. But Wednesday's 7.4% surge shattered resistance and made the breakout glaringly obvious and indisputable.
Smaller gold miners' technicals, sentiment, and fundamentals all support much higher stock prices. The fundamentals should become even clearer after the current Q2 earnings season wraps up in mid-August. Over the next couple of weeks I will be going through all the new GDX top 25 and GDXJ top 25 quarterly reports, and I look forward to analyzing and sharing what they reveal in my next essays.
There is an irony in how most traders treat major technical reversals. The worst time to buy gold stocks is after they have already surged and everyone is wildly bullish, as in late January. Giving in to popular greed and euphoria to buy at elevated levels is a mistake, and it usually ends in serious losses when inevitable drawdowns hit technicals and sentiment.
The best time to buy gold stocks is when major selloffs are maturing, as they have been over the last couple of months. That is why we have been aggressively adding smaller, fundamentally superior gold miners with strong near-term production growth in our subscription newsletters, despite the difficult gold environment. Yet when traders should be most interested in buying low, they have mostly capitulated and fled the sector.
Successful trading requires staying informed about markets so that opportunities can be recognized as they arise. We can help. For decades, we have published popular weekly and monthly newsletters focused on contrarian speculation and investment. They draw on my experience, knowledge, wisdom, and ongoing research to explain what is happening in the markets, why it is happening, and how to trade it with specific stocks.
Our integrated contrarian approach has been highly successful, and readers can benefit for only $12 an issue. We extensively research gold and silver miners to identify cheap, fundamentally superior mid-tiers and juniors with outsized upside potential. Sign up for free email notifications when we publish new content. Better yet, subscribe today to our acclaimed newsletters and start growing smarter and richer.
The bottom line is that gold stocks have just achieved a major technical breakout. Both the miners and the metal rocketed higher midweek on no news, shattering the upper resistance of parallel, massive falling-wedge chart patterns. These decisive upside breakouts suggest recent years' powerful bull runs are resuming. Bullish technicals are reinforced by deeply bearish herd sentiment and spectacular fundamentals.
This is especially true for the smaller mid-tier and junior gold miners in GDXJ. Earlier this year, GDXJ finally exceeded 15-year-old records despite much higher gold-miner earnings. Over the last five months, it has swung from nearly decade-high overbought conditions to nearly four-year-extreme oversold conditions. And the smaller gold miners are now reporting their second-best quarterly results ever. What a time to buy.
Adam Hamilton, CPA
August 7, 2026
Copyright 2000 - 2026 Zeal LLC (www.ZealLLC.com)
About the Author
Adam Hamilton
Zeal LLC specializes in stock-market speculation and investment from a contrarian perspective. It studies global markets in search of buying-low opportunities in undervalued and out-of-favor sectors before later selling high. The results are published in financial-market newsletters designed to help readers learn to thrive. Over the years, customers have come from all U.S. states and more than 60 countries.
More:

