Gold Resumes Skidding Amid Fresh Contract Premium, Fed Holds Rates Steady
Key Takeaways
- •Gold posted a net weekly loss of 17 points (-0.4%) despite the settlement price appearing to rise, as the COMEX front-month contract rolled from August to December and incorporated 60 points of fresh premium.
- •The Federal Open Market Committee maintained the federal funds rate at 3.50%–3.75%, with three members—Hammack, Kashkari, and Logan—voting to raise rates.
- •Real interest rates remain negative, as the policy rate of 3.50%–3.75% sits below the average twelve-month inflation rate of 4.0%, a condition that has historically been supportive of gold prices.
- •Q2 real GDP growth was estimated at just 1.5%, with 81% of nominal GDP growth attributable to inflation rather than genuine economic expansion.
- •The S&P 500's trailing twelve-month price-to-earnings ratio stands at 41.3x, far exceeding its long-term historical average of roughly 15–16x.
Gold Resumes Skidding Amid Fresh Contract Premium, Fed Holds Rates Steady
By Mark Mead Baillie
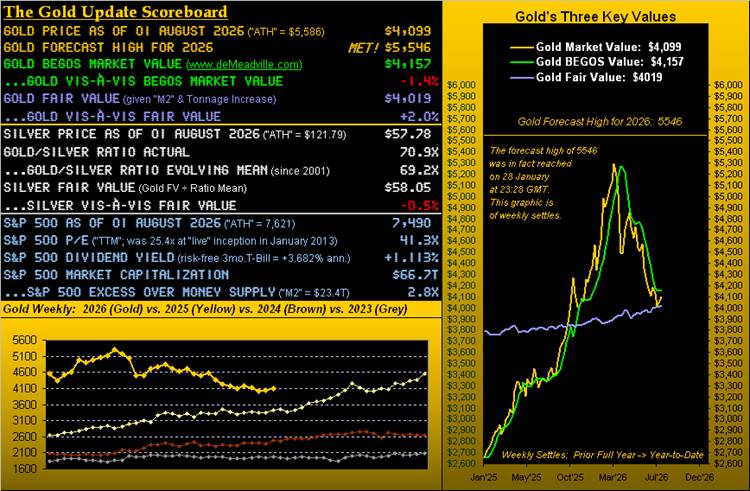
Gold posted a modest weekly decline despite an apparent uptick in the settlement price, as the COMEX futures front-month contract made its annual four-month leap from August to December, incorporating +60 points of fresh premium into the price. The August-to-December transition is a standard feature of COMEX gold's active-month cycle, which includes February, April, June, August, and December contracts. Although December gold settled Friday at 4,099 — higher than the prior week's August settle of 4,056 — gold actually netted a mild loss of -17 points (-0.4%) for the week, rather than the +43-point (+1.1%) gain that the premium injection might have suggested. While 60 points is less than gold's current expected daily trading range of 86 points, charting by the continuous contract shows the discrepancy clearly in weekly bars from a year ago to date. The red-dotted parabolic trend remains Short through 20 consecutive weeks, though price action may be attempting to form a floor.
Gold and Precious Metal Equities
Among primary precious metal equities over the past year, percentage performance rankings are as follows: Pan American Silver (PAAS) +58%, the Global X Silver Miners ETF (SIL) +54%, Newmont (NEM) +50%, the VanEck Vectors Gold Miners ETF (GDX) +43%, Franco-Nevada (FNV) +35%, Gold itself +25%, and Agnico Eagle Mines (AEM) +18%. The broad outperformance of silver-linked equities relative to gold itself is consistent with silver's historically higher beta to precious metal price moves.
The Federal Reserve and Inflation
On Wednesday, the Federal Open Market Committee voted to maintain the federal funds rate within the 3.50%–3.75% target range. The author, having believed for over two years that a rate increase would be appropriate, acknowledged resigning to the likelihood that the FOMC would hold steady. However, three FOMC members — Hammack, Kashkari, and Logan — voted to raise rates.
Looking ahead to the September 16 Policy Statement, further dissent among the 12 voters is possible, potentially even involving directional disagreement. According to the author's inflation summary for June, the average 12-month rate stands at +4.0%, suggesting a rate increase may be warranted, while the annualized pace specific to June alone was a deflationary -1.0%, suggesting a rate cut could be justified. With the policy rate at 3.50%–3.75% and the average 12-month inflation rate at +4.0%, real interest rates remain in negative territory — a condition that has historically been associated with support for non-yielding assets such as gold, which makes the current price weakness notable.
BEGOS Markets Standings
Through the first seven months of 2026, silver — which had topped the BEGOS standings at the end of January — has since fallen to the bottom. Meanwhile, Big Oil continues to lead amid ongoing geopolitical conflict, and questions persist about how long the S&P 500 can sustain double-digit annual percentage gains.
BEGOS Markets Trends
On near-term trends across all eight BEGOS components based on 21-day daily bars, oil and copper are the most consistently trending upward, bonds are the most consistently trending downward, and the remaining components show inconsistent directional patterns.
Economic Barometer and S&P 500
Both the Economic Barometer and the S&P 500 have been in sideways trends over the past three months, driven by concerns over war, interest rates, and what may eventually become earnings concerns. Of the 11 incoming Economic Barometer metrics last week, only four improved period-over-period.
Q2's first estimate of real GDP growth was just +1.5%. Adding back the Chain Deflator of +6.3% — the highest since Q2 2022, emerging from the COVID period — reveals that 81% of Q2's total nominal GDP growth was attributable to inflation rather than real economic improvement.
For Q2 earnings season, of the 289 S&P 500 constituents that have reported so far, 79% have exceeded their year-over-year quarterly earnings. However, with the honestly-calculated S&P price/earnings ratio (trailing twelve-month basis) settling at 41.3x — well above its long-term historical average of approximately 15–16x — the article notes that paying $41 for $1 of earnings — with the additional risk of principal loss — represents significant valuation risk.
Gold and Silver Profiles
Century-to-date, gold is +1,397% and silver +1,145%, while the S&P 500 is +839% including dividend reinvestment (or +467% excluding dividends), having weathered two -50% corrections during the Dot-Com crash and the Financial Crisis.
Both gold and silver are currently trading within congestive 10-day Market Profiles. Gold prices are basis December; silver prices remain basis September.
Gold Structure
On the monthly continuous contract candlestick chart spanning the past six years, the rightmost candle (July 2026) is the narrowest by both points (253) and range (6.4% low-to-high) since August 2025. The broader-term technical stance is negative; should a floor fail to form at current levels, further decline toward 3,500 is possible.
Financial Media Reaction to FOMC
Following the Wednesday FOMC Policy Statement and the subsequent press conference, the S&P 500 recorded an intra-day decline of -1.8%. Several media outlets offered dramatic characterizations:
- Bloomberg: "Nasdaq 100 enters correction" — despite the index having already been declining for the prior eight weeks.
- Barron's: "…historic crash…" and Dow Jones Newswires: "…Savage Selloff…" — characterizations the author disputes, noting that across the last 46 years there have been over 1,000 worse intra-day S&P 500 drops.
- Bloomberg: "Why fresh volatility means a 'valuation opportunity' is opening up in U.S. stocks"
The author closes with a quote from Andy Grove, former CEO of Intel and author of "Only the Paranoid Survive" (1996): "Complacency breeds failure."
Source: GoldSeek
About the Author: Mark Mead Baillie has an extensive business career spanning banking and financial services at Banque Nationale de Paris, corporate research at Barclays Bank, and analyst and corporate lending roles at Société Générale. For the past 22 years, he has operated de Meadville International, which follows the BEGOS complex of markets (Bond/Euro/Gold/Oil/S&P). He holds a BS in Business from the University of Southern California and an MBA in Finance from Golden Gate University. He authors the weekly column "The Gold Update" and is known in financial website communities as "mmb" and "deMeadville."

