Technical Scoop: Gold, Silver and Mining Stocks Hold Near Key Levels
Key Takeaways
- •Gold has held the $4,000 level after posting a recent low of $3,941, but Chapman says a bottom is not confirmed without a stronger move higher.
- •Silver rose 4.1% this week, and the Gold Bugs Index and TSX Gold Index both advanced, showing leadership from silver and mining shares.
- •Chapman says silver would need to break above $60 and then $72 to support the case that a bottom is in place.
- •For gold stocks, the TSX Gold Index needs to clear 860 and the HUI needs to move above 705, preferably 740, while their recent lows remain key support.
- •Chapman says a break below $50 in silver or below $3,800 in gold would force a reassessment of the precious-metals bull market.
Technical Scoop: Gold, Silver and Mining Stocks Hold Near Key Levels
David Chapman
Excerpt from this week’s Technical Scoop: Domination Repeat, Cheap Oil, Rate Rise
Gold and silver
Source: www.stockcharts.com
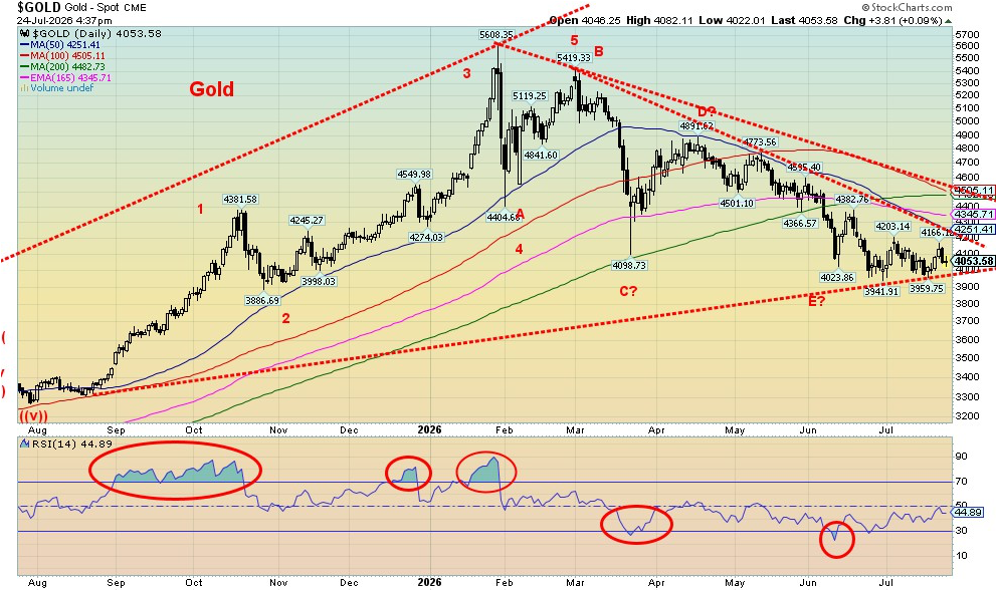
Gold continues to drift near its recent lows. That is somewhat encouraging, since no new lows have been made. The low came almost three weeks ago at $3,941. Since then, gold has held the $4,000 level, although it has made little progress to the upside. The recent high was $4,203. Resistance is now seen at $4,250 and especially at $4,500. Chapman says he would not begin to feel comfortable that a potential low is in place until gold moves through $4,600 and preferably even $4,700.
The positive seasonal period for gold has now begun, and Chapman says a bottom could be forming. For now, the key level to watch is $4,000. If that level fails, gold could quickly move to $3,800 and even $3,400, though he says that would likely be the extent of the decline. The near-term setup matters because gold is still close to the levels that have defined the current pullback, so confirmation will require more than holding steady around round numbers.
Gold rose 0.9% this week. Chapman said he was encouraged by silver’s 4.1% gain, along with strength in gold shares. The Gold Bugs Index (HUI) rose 5.7%, while the TSX Gold Index (TGD) gained 6.3%. If the sector is going to move higher, he said, silver and gold stocks need to lead, and that is what happened this past week.
Platinum did not participate, falling 0.2%, while palladium declined 0.5%. Copper, however, rose 1.2%. As noted in the report, copper’s advance is generally constructive for gold because the two metals often correlate well.
Silver’s leadership was also seen as encouraging. Chapman says silver would need to break above $60 and then $72 before it would be reasonable to conclude that a bottom is in place. Silver recently fell to $54.74 at a time when gold did not make new lows for the move, creating what he described as a divergence. That gap between the two metals is one of the signals traders are watching for evidence that selling pressure is easing.
He also sees a five-wave decline in silver, possibly an ABCDE pattern that, if correct, could soon give way to a rebound. After such rebounds, he notes, prices typically retreat again. Silver’s slide toward $54 was a classic test of the previous breakout above $50. Still, he says more work is needed before confidence in an upside breakout can be restored. Until then, downside risk remains.
In a worst-case scenario, a break below $50 would lead him to conclude that the bull market is over for the time being. He does not expect that outcome, but given how close silver remains to that level, he says it is a concern.
Source: www.stockcharts.com
Gold stocks
The gold stocks continue to show similar patterns. Chapman notes that this pullback has seen the TGD fall only 38%, compared with 55% for silver and 30% for gold. He says gold and silver miners typically underperform when those metals weaken, and a decline of 70% would not be unusual for the TGD in such circumstances. That has not happened, which he considers encouraging.
He says the gold stocks appear to be under accumulation. However, as with gold and silver, new highs are needed to confirm that the decline is over. For the TGD, the breakout level is 860. For the HUI, the key level is 705, preferably above 740. At the same time, recent lows must hold: 692 for the TGD and 580.67 for the HUI.
If those lows were broken, Chapman said the entire precious-metals bull market would need to be reconsidered. He would allow for a small penetration, but sees the main danger zone as gold below $3,800, silver below $50, the TGD below 650, and the HUI below 550. Those thresholds give readers a practical map of where the current technical structure would start to weaken further.
He concludes by saying he hopes the seasonal pattern proves helpful.
Source: www.stockcharts.com
Copyright David Chapman 2026
Read the FULL report here: Technical Scoop: Domination Repeat, Cheap Oil, Rate Rise
Disclaimer
David Chapman is not a registered advisory service and is not an exempt market dealer (EMD) nor a licensed financial advisor. He does not and cannot give individualized market advice. He has worked in the financial industry for more than 40 years, including at large financial corporations, banks, and investment dealers. The information in this newsletter is intended only for informational and educational purposes and should not be construed as an offer, a solicitation of an offer, or a sale of any security.
Every effort is made to provide accurate and complete information, but there can be no guarantee that the commentary contains no errors. Chapman makes no claims, promises, or guarantees about the accuracy, completeness, or adequacy of the content and expressly disclaims liability for errors and omissions. He says he will use his best efforts to ensure the accuracy and timeliness of all information.
The reader assumes all risk when trading in securities, and Chapman advises consulting a licensed professional financial advisor or portfolio manager such as Enriched Investing Incorporated before proceeding with any trade or idea presented in the newsletter. He may own shares in companies mentioned in the newsletter. Before making an investment, prospective investors should review each security’s offering documents, which summarize the objectives, fees, expenses, and associated risks.
Although artificial intelligence (AI) may be used from time to time, AI output is monitored and adjusted if necessary for accuracy. Chapman shares his ideas and opinions for informational and educational purposes only and expects readers to perform due diligence before considering any position in a security. That includes consulting with a licensed professional financial advisor such as Enriched Investing Incorporated. Performance is not guaranteed, values change frequently, and past performance may not be repeated.
About the author
David Chapman
Website:
Disclaimer: David Chapman is not a registered advisory service and is not an exempt market dealer (EMD) nor a licensed financial advisor. He does not and cannot give individualized market advice. He has worked in the financial industry for more than 40 years, including at large financial corporations, banks, and investment dealers. The information in this newsletter is intended only for informational and educational purposes and should not be considered a solicitation of an offer or sale of any security. The reader assumes all risk when trading in securities, and Chapman advises consulting a licensed professional financial advisor before proceeding with any trade or idea presented in this newsletter. He may own shares in companies mentioned in the newsletter. He shares his ideas and opinions for informational and educational purposes only and expects readers to perform due diligence before considering any position in a security, including consulting with a licensed professional financial advisor.

