Gold Price Today: How Oil, the Dollar, and Fed Rate Bets Are Driving Gold Movements
Key Takeaways
- •Spot gold declined approximately 0.6 percent to roughly $4,103 per ounce on July 23, 2026, as oil reached a six-week high, two-year Treasury yields hit a multi-month peak, and traders raised the probability of a September Fed hike to about 77 percent.
- •Gold fell approximately 1.4 percent to about $4,131 per ounce on June 23, 2026, when the U.S. dollar climbed to a one-year high amid expectations of stronger Federal Reserve tightening.
- •Weaker-than-expected U.S. jobs data on July 3, 2026 reduced the implied probability of a September Fed hike to approximately 54 percent, prompting gold to rise roughly 1.3 percent to around $4,176 per ounce.
- •Real yields are identified as the single most influential macroeconomic input for gold pricing, as higher real yields increase the opportunity cost of holding non-yielding bullion.
- •Sustained gold accumulation by emerging market central banks provides structural floor support that can absorb supply during pullbacks, although it does not override short-term price movements driven by oil, dollar, and rate dynamics.
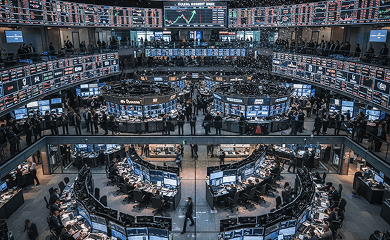
Gold has experienced sharp swings in recent sessions, with the metal trading more like a broad macroeconomic barometer than a traditional commodity. Three primary drivers are currently shaping gold's price action: oil prices, the U.S. dollar, and market expectations surrounding the Federal Reserve's next policy move.
Gold typically declines when rising oil prices stoke inflation expectations that push Treasury yields higher, when the U.S. dollar strengthens, or when markets increase the odds of a Fed rate hike. These forces raise the opportunity cost of holding non-yielding bullion and reduce purchasing power for foreign buyers. Conversely, softer oil prices, a weaker dollar, or diminishing hike expectations tend to support gold prices.
Oil Prices and the Inflation Transmission Channel
Oil feeds directly into inflation expectations. When crude prices jump, markets often anticipate stickier inflation and push Treasury yields higher to compensate. Elevated yields increase the opportunity cost of holding an asset that generates no interest income, which is why a rapid oil rally can exert short-term downward pressure on gold.
This dynamic was visible on July 23, 2026. Spot gold slipped approximately 0.6 percent to roughly $4,103 per ounce, while oil climbed to a six-week high following reports of strikes in the Middle East. Two-year Treasury yields reached a fresh multi-month high, and traders raised the probability of a September Fed hike to approximately 77 percent. The combination of these factors weighed on bullion (Reuters via MarketScreener India).
However, rising oil does not uniformly pressure gold lower. When an oil shock appears geopolitical in nature rather than growth-positive, safe haven demand for gold can offset or exceed the yield-driven headwind. In the early stages of a risk-off move, both oil and gold can rise simultaneously before broader macroeconomic conditions stabilize.
On oil-driven trading days, market participants closely track front-end Treasury yields alongside breakeven inflation rates. If breakevens rise but two-year yields climb even faster, the configuration tends to be bearish for gold.
Dollar Strength and Foreign Demand
Gold is priced globally in U.S. dollars. When the dollar strengthens, investors purchasing in euros, yen, or rupees must pay more in local currency for the same ounce, which tends to cool marginal demand. Additionally, dollar strength frequently coincides with tighter U.S. financial conditions and higher real yields, both of which are direct headwinds for gold.
On June 23, 2026, spot gold fell approximately 1.4 percent to about $4,131 per ounce as the dollar reached a one-year high, with traders leaning into expectations of stronger Fed tightening. The currency move accounted for much of that session's price action (Reuters via MarketScreener).
The relationship is not a perfect inverse correlation. During periods of acute market stress, capital can flow into both the dollar and gold simultaneously. For the most part, however, a rising dollar serves as a persistent headwind for bullion, particularly when it reflects policy divergence favoring the United States.
Federal Reserve Rate Expectations
In market terminology, "rate bets" refers to the policy path implied by futures and options on federal funds. When the odds of a hike increase, short-dated Treasury yields typically rise. This pushes real yields higher after adjusting for inflation expectations, and real yields represent the single most influential macroeconomic input for gold pricing.
The recent swings illustrate this mechanism. On June 25, 2026, spot gold drifted near a seven-month low, with markets pricing approximately a 66 percent probability of a September hike, according to the CME FedWatch tool (Reuters via Kitco). One week later, softer jobs data reduced those odds to approximately 54 percent, and gold rose roughly 1.3 percent to around $4,176 per ounce on July 3 (Reuters via Kitco).
The general pattern holds: stronger-than-expected economic data lifts hike odds and pressures gold, while weaker data trims odds and supports prices. The exception occurs when growth fears overwhelm the rate mechanics, sending both yields and risk assets lower while gold attracts haven demand.
The following table summarizes the typical directional relationships:
| Driver Move | Likely Gold Reaction | Primary Mechanism |
|---|---|---|
| Oil rises fast | Down to flat | Inflation expectations and yields climb faster than haven demand |
| Oil falls | Up to flat | Softer inflation impulse eases yields and policy pressure |
| Dollar strengthens | Down | More expensive for non-dollar buyers; tighter financial conditions |
| Dollar weakens | Up | Easier access for global buyers; often lower real yields |
| Hike odds rise | Down | Higher real raises raise opportunity cost of gold |
| Hike odds fall | Up | Lower real yields and softer dollar provide relief |
Geopolitical Risk and Its Override Effect
Short bursts of geopolitical risk can disrupt the usual macroeconomic relationships. Oil may spike on supply fears, the dollar can attract safe-haven flows, and gold can still rise if uncertainty becomes the dominant market force. The duration of that phase is the critical variable.
In July 2026, headlines surrounding strikes in the Middle East helped push oil to a six-week high. This coincided with a dip in gold, primarily because two-year Treasury yields surged and Fed hike odds approached 75 percent for September. In that instance, the rates channel prevailed over the geopolitical impulse (Reuters via MarketScreener India).
When geopolitical tensions persist and begin to threaten economic growth, the dynamic can reverse. Oil may remain elevated, but yields decline as markets price in slower activity and a less hawkish Federal Reserve. That scenario is where gold has historically outperformed despite high energy costs.
Gold's Role as a Hedge in 2026
As a long-term diversifier against policy shocks and tail risks, gold continues to serve its function. The challenge for holders is path dependency. A near-term overshoot in real yields can pressure gold before its hedging benefits materialize. Conversely, during episodes of liquidity stress or unexpected shocks, gold tends to respond more quickly.
A defining feature of the 2026 environment is the speed at which rate expectations shift with each economic data release. A single week can contain both a hawkish surprise and a dovish correction. This volatility underscores the importance of distinguishing between trading and hedging objectives.
Structural demand from central banks has also been a notable undercurrent in recent years. Sustained gold accumulation by emerging market central banks adds a layer of floor support distinct from the short-term macro drivers this article focuses on. This buying does not override intraday price action, but it can absorb supply during pullbacks and contribute to a higher baseline over time.
Gold Versus Bitcoin: Divergent Sensitivities
Gold and Bitcoin occasionally move in tandem but often diverge. Bitcoin behaves like a high-beta macro asset during risk-on sessions and adopts the "digital gold" narrative during stress periods. That flexibility means Bitcoin can rise alongside yields when technology stocks rally, a configuration typically unfavorable for bullion. During sharp risk-off episodes, however, both assets can attract bids simultaneously.
The clearest distinction lies in sensitivity to the dollar and real yields. Gold is tightly correlated with both. Bitcoin responds more to liquidity conditions, equity risk appetite, and crypto-specific capital flows. For hedging interest rate risk specifically, gold offers a more direct relationship. For those hedging against currency debasement over a five- to ten-year horizon, some investors combine both, while noting their substantially different volatility profiles.
Additionally, Bitcoin often reacts first to liquidity-related headlines, while gold tends to respond first to interest rate and currency moves. The sequencing becomes relevant when intraday narratives shift rapidly. Gold's substantially deeper and more liquid market, anchored by centuries of institutional infrastructure across central banks, exchanges, and physical bullion dealers, also means that price discovery in gold tends to be more continuous and less prone to gaps compared with Bitcoin.
Key Weekly Market Indicators
Several core indicators help explain the majority of gold's price movements on any given week:
- The U.S. dollar index and two-year Treasury yields at market open
- Front-month crude oil futures and breakeven inflation spreads
- CME FedWatch probability readings, particularly for the next FOMC meeting
- Economic data releases: CPI and PCE inflation, nonfarm payrolls, ISM manufacturing and services indices
- Federal Reserve communications: the Chair's remarks, FOMC minutes, and Summary of Economic Projections on decision days
- Energy market developments: OPEC updates, inventory reports, and major geopolitical events
- Gold-backed ETF flows and COMEX speculative positioning, reported weekly through the CFTC Commitments of Traders data, which together capture shifts in Western investment demand and leveraged trader sentiment
Tracking which variable moved first and what followed provides useful context. For example, if oil led the session, whether Treasury yields subsequently confirmed the move. If the dollar surged, whether real yields also shifted or the move was primarily driven by risk aversion.
Trading Versus Long-Term Holding Considerations
Short-term traders typically focus on specific catalysts and price velocity. For this group, the core dashboard consists of the dollar index and two-year Treasury yields, with position sizing adjusted ahead of known binary events such as employment reports and Fed decisions.
Long-term holders, by contrast, focus on regime shifts: whether the policy cycle is tilting toward more restrictive or easier conditions, and whether global growth is firm or deteriorating. These two axes explain most multi-quarter movements in gold.
Common Analytical Pitfalls
Several recurring errors can lead to misinterpretation of gold price action:
- Chasing oil headlines without monitoring yields. Oil can be bullish for gold in risk-off scenarios. Two-year yields and breakevens should be consulted before drawing conclusions.
- Overlooking the dollar's role. A stronger dollar can quietly pressure gold even when other macroeconomic inputs appear supportive.
- Misreading Fed probabilities. A 60 percent hike probability remains uncertain. Position sizing should reflect that uncertainty rather than implying false precision.
- Ignoring data revisions. Employment and inflation figures are subject to revision. Gold can retrace if the underlying narrative changes upon revision.
- Conflating safe-haven flows with trend changes. A single panic-driven spike does not establish a new regime. Event-driven risk should be distinguished from cyclical dynamics.
- Mixing trading and hedging objectives. Gold held as portfolio insurance should not be actively day-traded, and gold held as a trade should have a defined exit tied to a specific catalyst.
Frequently Asked Questions
Can gold rise on the same day the dollar strengthens?
Yes. During acute risk-off episodes, capital can flow into both the dollar and gold simultaneously, particularly when the trigger is geopolitical or credit stress rather than a clean repricing of rate expectations.
What happens when oil spikes but gold also rallies?
This typically indicates that safe-haven demand is overpowering the yield impulse, or that markets expect the oil shock to damage economic growth and lead to softer monetary policy. Monitoring whether two-year yields fade into the close can help clarify which force is dominant.
Do jobs reports consistently move gold?
They often do because they shift Fed rate expectations. On July 3, 2026, weaker-than-expected jobs data reduced the implied probability of a September hike to approximately 54 percent, and gold rose roughly 1.3 percent that session (Reuters via Kitco).
How do two-year Treasury yields factor in?
Two-year Treasuries track near-term Federal Reserve policy expectations. When two-year yields surge, real yields typically follow, creating a bearish environment for gold. On July 23, 2026, two-year yields reached a multi-month high and gold softened (Reuters via MarketScreener India).
Is a 66 percent hike probability definitive?
No. It represents a market-implied snapshot, not a certainty. On June 25, 2026, FedWatch indicated approximately 66 percent odds for a September hike as gold traded near a multi-month low (Reuters via Kitco). The following week, those odds declined and prices recovered.
Why did gold fall when the dollar hit a one-year high?
A stronger dollar raises the cost of gold for overseas buyers and frequently coincides with higher real yields. On June 23, 2026, that combination pushed spot prices lower by approximately 1.4 percent (Reuters via MarketScreener).
Do central bank purchases override oil, dollar, and rate dynamics?
Central bank buying can moderate price declines over periods of months, but it has limited influence on intraday movements. Strategic purchases provide a floor during weak periods, while short-term price action remains driven primarily by the dollar, oil, and rate expectations.
Source: CryptoDaily
Disclaimer: This article is provided for informational purposes only. It is not offered or intended to be used as legal, tax, investment, financial, or other advice.

