Gold Price at Critical Juncture: Analyst Sees Breakout Likely but $3,300 Downside Risk Persists
Key Takeaways
- •Gold tested a descending resistance line this week but failed to secure a weekly close above it, leaving the metal near the narrow end of a tightening formation.
- •Analyst Sqeaky Mouse considers an upside breakout the more probable scenario, with potential targets at $4,400 and $4,800 if resistance is decisively broken.
- •A major support zone around $3,940 has held since November 2025 and is reinforced by the 75-week exponential moving average, making it a critical level for buyers to defend.
- •A breakdown below the $3,940 support could expose progressively lower levels, including $3,700, $3,550, $3,400, and potentially $3,300.
- •Gold reached a record high near $5,600 earlier in 2026 and has traded beneath the descending resistance line throughout its subsequent correction.
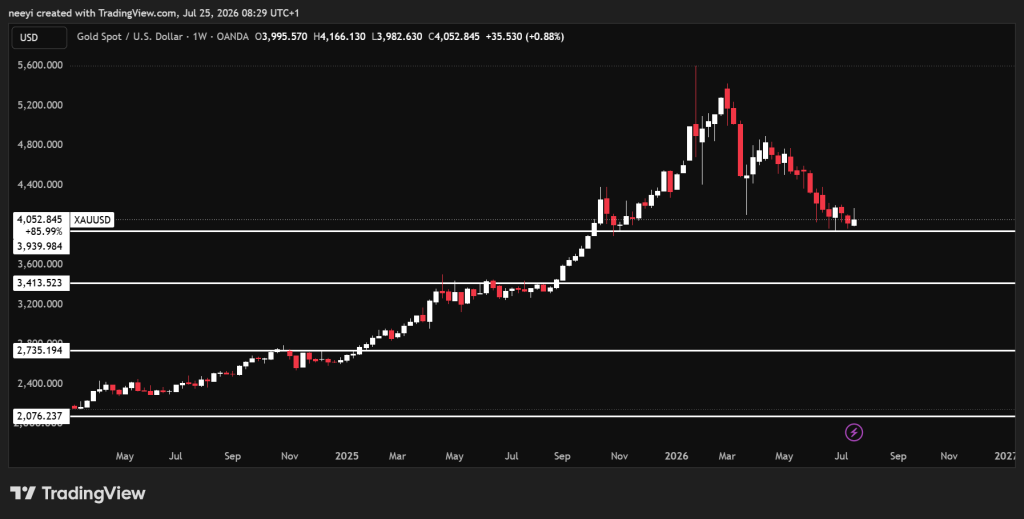
Gold has arrived at a decisive point where a single move could set its trajectory for months. This week, the gold price tested a major descending resistance line but failed to secure a weekly close above it. That rejection leaves gold trapped near the narrow end of a large chart formation, where the gap between support and resistance continues to compress.
Analyst Sqeaky Mouse believes an upside breakout remains the more probable outcome. However, the chart also presents a bearish alternative that could send gold toward $3,300 if buyers lose control.
Gold has traded beneath a descending resistance line since reaching a record high near $5,600 earlier in 2026. Each recovery attempt has ended below that line, gradually pushing the gold price toward a rising support area. In this kind of weekly structure, traders often focus on closing prices rather than intrawEEK moves because a close above resistance or below support can provide a clearer signal that the range has actually broken.
Gold did tap resistance this week but failed to close above. We are no doubt in a pivotal spot as I see a breakout taking us back above $5,000 and a breakdown to $3,300. Breakout is the more likely scenario out of this formation. pic.twitter.com/94StaAK0Xb — Sqeaky Mouse (@TheSqeakyMouse) July 24, 2026
Those two boundaries have formed a tightening structure, leaving gold with progressively less room to trade between them. A larger directional move could materialize once the price exits this formation.
Sqeaky Mouse considers an upside breakout the more likely scenario. A convincing weekly close above the descending resistance could reopen the route toward $4,400 and $4,800. Continued strength could eventually carry the gold price back above $5,000.
The bearish scenario cannot be dismissed, however. A breakdown beneath the lower boundary would weaken the entire formation and could expose the $3,300 region.
Gold Must Defend the $3,940 Support Zone
Gold currently trades near $4,050, placing it slightly above a major support zone around $3,940. This level has protected the gold price since November 2025 and remains one of the most significant areas on the weekly chart.
The 75-week exponential moving average provides additional support near the same region. Gold has remained above this moving average throughout much of its broader advance, making the current test especially critical. Moving averages are widely used as trend gauges, and when they overlap with horizontal support, that area can become a key reference point for both breakout and breakdown scenarios.
Buyers could preserve the larger bullish structure if the $3,940 support continues to hold. Conversely, bears would gain greater control if gold records a clear weekly close beneath that area.
Such a breakdown could open several lower price levels:
- Initial support could appear near $3,700.
- Further weakness could send gold toward $3,550.
- Deeper losses could expose the $3,400 region.
- A break beneath $3,400 could place $3,300 and $3,200 within reach.
These targets represent possible support areas rather than guaranteed destinations. Gold could pause or recover from any of them if demand returns.
Gold remains caught between two sharply different outcomes. An upside breakout could confirm that the correction has ended and place the gold price on course for another test above $5,000. A breakdown beneath $3,940 would paint a contrasting picture, where the $3,700 and $3,550 levels may provide temporary support, but sustained weakness could pull gold toward $3,400 and eventually $3,300.

