Gold: Holding Firm Heading into the S&P's Seasonal Crash Window
Key Takeaways
- •Gold fell 3.4% for the week to 4,504 after five consecutive weekly gains, making it one of its weakest weekly results of the year so far.
- •The decline followed comments from Fed Chair Kevin Warsh that policy might need to tighten if inflation does not move closer to 2%.
- •The Chicago PMI for August dropped to 47.1 from 57.6, moving from expansion to contraction and marking its worst negative swing since February 2015, excluding April 2020.
- •The article said Gold’s broader trend remains upward, with nearby support identified between 4,509 and 4,366 if short-term weakness deepens.
- •The S&P 500 was described as entering a historically vulnerable seasonal period, with September cited as its weakest average calendar month.
Gold: Holding Firm Heading into the S&P's Seasonal Crash Window
By Mark Mead Baillie
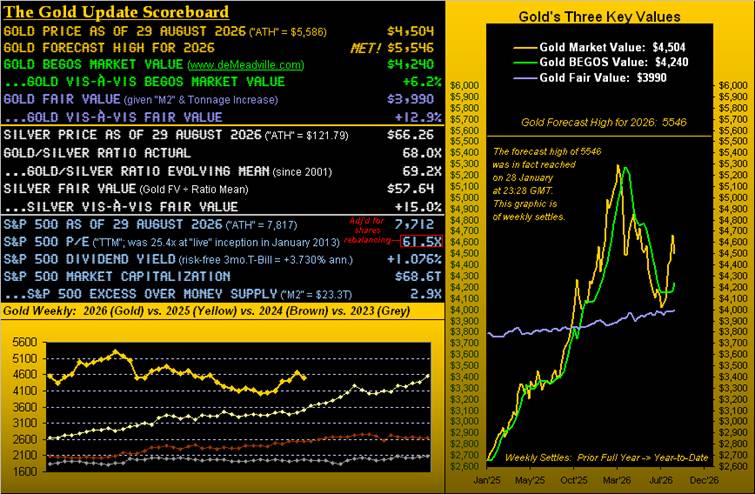
After five consecutive weekly gains, Gold posted a down week, settling Friday at 4,504. It was Gold's fourth-worst weekly performance (-3.4%) of the 34 full trading weeks year-to-date, and Friday alone was the 12th-worst single session (-3.2%) across 2026's 166 trading days so far. According to the upper Scoreboard's right-hand panel, however, the week's dip appears to be nothing more than a blip.
To be clear, this analysis is not predicting an imminent outright crash for the S&P 500. Still, this is seasonally "that time of year," with crash conditions — notably the absence of both supportive earnings and money supply — more acute than at the time of any of the following episodes: Black Tuesday in 1929, the Garzarelli-led break in 1987, the Asian Contagion of 1997, the Russian Debt Crisis of 1998, the DotCom collapse of 2000, the Financial Crisis of 2008, and the February 2020 slide into Covid. In short, the money simply is not there; what remains is the fear, which has yet to arrive. The seasonal framing has a statistical basis: September has historically been the S&P 500's weakest calendar month on average, and several of the market's most notorious drawdowns — 1929, 2008, and the Covid break of early 2020 among them — either began in or passed through the September–October window.
On Gold specifically: just as the metal rallied two weeks ago on Treasury Secretary Scott Bessent's move to lower yields, price fell back sharply on Friday after Fed Chair Kevin Warsh, speaking in Wyoming, indicated that the Federal Open Market Committee might have to vote to tighten money should inflation fail to recede toward the desired annualized 2% target. His stated current inflation rate — on a Personal Consumption Expenditures basis — of 3.7% matches the overall "12-Month Summation" average through July. The exchange is a familiar dynamic for gold watchers: because the metal pays no interest, expectations of tighter policy — which lift yields and support the Dollar — tend to raise the opportunity cost of holding Gold, while dovish shifts tend to do the reverse.
By contrast, the "July Annualized" column averages just 1.8%, helped by slowing headline inflation in both the retail measure's Consumer Price Index and the wholesale measure's Producer Price Index.
Could July simply have been a "one-off" month? Seasonally, July can indeed be subdued, particularly by the PPI headline inflation measure, with the typical mid-year lull in constructive economic stimulus.
A further view of each monthly inflation metric annualized, one year ago to date, shows the metrics for July converging toward the Fed's preferred 2% inflation level following a deflationary June.
From the conventional-wisdom Gold perspective, lower rates and yields are friendly because they depress the Dollar, while the reverse is inhospitable. Recall as well from last week's piece that Gold had reached well above its BEGOS Market Value — as also depicted in the opening Scoreboard — suggesting price was potentially at a near-term peak. Even so, despite the poor week, the broader picture continues on balance in resumption of upside form per the weekly bars and the rightmost blue parabolic Long trend dots.
Month-End Standing: Metals and Equities
With month-end arriving (less one trading day), the year-over-year percentage tracks of Gold and premier metals equities show the leverage of the latter clearly on display: Gold itself +30%, Franco-Nevada (FNV) +43%, Agnico Eagle Mines (AEM) +48%, Pan American Silver (PAAS) +60%, the VanEck Vectors Gold Miners exchange-traded fund (GDX) +62%, and Newmont (NEM) and the Global X Silver Miners exchange-traded fund (SIL) both +77%. That spread is a textbook illustration of how miners, as operating companies with fixed costs, tend to amplify the underlying metal's moves in both directions.
In the year-to-date BEGOS Market Standings, Gold — just a month ago third-from-the-bottom at -5.4% — now sits in fourth position at +4.0%. Silver, however, remains in the cellar, even as "Cousin Copper" stands +15.0%.
Across the BEGOS components' respective past month (21 trading days), seven of the eight — all except Copper, which has already been having an excellent year — show positive grey trendlines. That said, there is near-term caution around the "Baby Blue" dots depicting trend consistency, which are rolling over notably for Gold, Silver, and the Euro. As regular readers know, this leading indicator falling below the +80% level portends still lower prices near-term, as occurred for the Euro at Wednesday's settle. Neither Gold's nor Silver's Baby Blues have yet broken below +80% at this writing. Should they do so in the next day or two, Gold's nearby support structure runs from 4509 down to 4366, and for Silver (currently 66.26) from 66.98 down to 62.45. Even so, the analysis does not suggest abandoning the precious metals during this near-term adversity — particularly with the S&P 500 entering what is historically "Crash Season."
In the 10-day Market Profiles for Gold and Silver, the prices of both precious metals moved lower over the past week, with their white lines denoting Friday's settles; volume-dominant support and resistance levels are as labeled.
Economic Barometer and the Chicago PMI
The Economic Barometer, having recently stopped declining, saw only four of its incoming metrics for the past week come in worse period-over-period. One of them, however, was significant: the Chicago Purchasing Managers' Index for August slipped from an "expansion" reading of 57.6 in July to a "contraction" reading of 47.1. The Chicago PMI, one of the first reads on each month's manufacturing activity, is watched partly because a reading above 50 signals growth while one below 50 signals contraction — a threshold August's print crossed decisively. Excluding the onset of Covid in April 2020, this August's negative Chi PMI swing was the worst since February 2015 — after which the S&P 500 fell by as much as -11.5% over the ensuing six months. And again, the index now sits at the threshold of its potential "Crash Season," although of the historical occurrences cited, only two crashes of -50% have taken place so far this century.
Gold's Monthly Structure
While the herd blows bubbles as the S&P itself bubbles, Gold's monthly structure so far this decade offers something of substance. Gold did go through a bubbling stage earlier this year, reaching the All-Time High of 5,586 on 29 January — then +44% above Fair Value — before returning to it by 24 June. As currencies have come and gone over the centuries, Gold has always endured; its periodic bubbles have been relatively "tiny bubbles" compared with those of Dollar debasement, debt, and — by understatement — the S&P.
The rightmost candle of the structure graphic shows an on-balance strong August: with one trading day still to go, Gold's +8.8% net month (even accounting for Friday's fall) is its best since February's +9.6%.
The Outlook and the Arithmetic
To sum up, a bit more near-term Gold slippage is envisaged, but hardly enough to flip the broader-based weekly parabolic trend from Long back to Short — that would require a further fall of roughly -10% from here. Instead, the 4,900s are being eyed on this overall upside run.
That target would be modest in the following context. Given the ratio of the S&P 500's market capitalization to liquid money supply of 2.9x, plus the ever-expanding insolvency of the U.S. Treasury, the following calculation is offered:
- Gold today: $4,504/oz. (Fair Value $3,990/oz.)
- "Print" $45.5 trillion to make S&P investors "whole" were the Index liquidated today
- "Print" $40.1 trillion to make the U.S. Treasury "whole" were its debt paid down today
The resultant Fair Value for Gold: $18,365/oz.
Or, as aforestated: adhere to Gold.
Source: The Gold Update / deMeadville, also on X: @deMeadvillePro. Copyright © 2010–2026. All Rights Reserved.
About the Author
Mark Mead Baillie has had an extensive business career, beginning with two years in banking and financial services at Banque Nationale de Paris, followed by three years of corporate research at Barclays Bank and six years as an analyst and corporate lender with Société Générale. For the last 22 years he has run his own financial services company, de Meadville International (demeadville.com), which comprehensively follows his BEGOS complex of markets (Bond/Euro/Gold/Oil/S&P) and the trading of the futures therein. His work is featured in Merrill Lynch Wealth Management client presentations, and he is the weekly author of "The Gold Update," known in the financial website community as "mmb" and "deMeadville." He holds a BS in Business from the University of Southern California and an MBA in Finance from Golden Gate University.
