Adam Hamilton Says Gold-Futures Speculators Have Been Missing From Recent Volatility
Key Takeaways
- •Gold recorded six daily losses of more than 2% in just over six weeks since early June, with an average decline of 2.9%.
- •Hamilton said recent weekly CoT reports did not show enough gold-futures speculator activity to explain several large gold price moves.
- •COMEX gold-futures contracts carried nearly 20 times leverage at cited midweek prices, making rapid adverse price moves highly risky for traders.
- •Hamilton linked recent gold volatility to catalysts including U.S. jobs data, Federal Reserve developments, Trump Truth Social posts and Middle East shipping concerns.
- •Total speculator long positions were 271,700 contracts in the latest reported CoT week, near levels Hamilton associated with the start of prior gold bull phases.
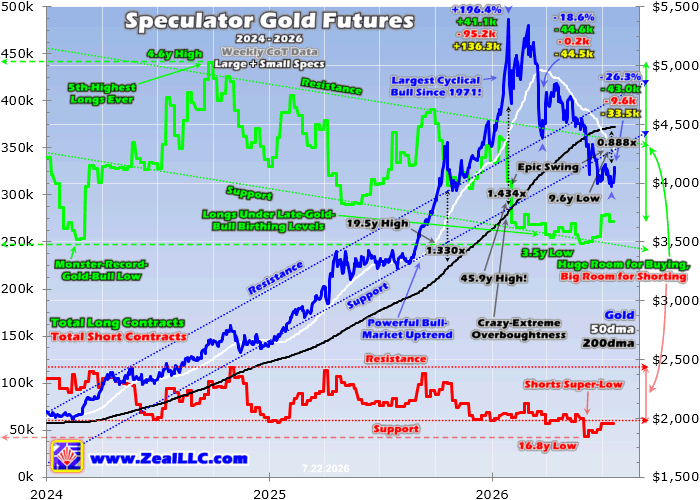
Gold has been unusually volatile since early June, with large swings and a pronounced downside bias, according to Adam Hamilton of Zeal LLC. In an article published July 24, 2026, Hamilton said several sharp declines in gold looked as though they were driven by futures trading because of their speed and scale, yet weekly positioning data for gold-futures speculators has not shown the kind of activity that would usually explain such moves.
Hamilton said American COMEX gold-futures speculators often dominate short-term moves in gold, particularly during U.S. trading hours, because futures allow traders to use substantial leverage. COMEX, operated by CME Group, is the world's primary exchange for gold-futures trading and its settlement prices are used as benchmarks across the global bullion market. Each COMEX gold-futures contract controls 100 troy ounces of gold, worth $413,550 at midweek prices cited in the article. Traders were required to hold $20,735 in margin for each contract, implying maximum leverage of 19.9 times. Hamilton noted that this was still below more typical levels because of recent volatility, with 20 to 25 times leverage common in normal markets.
At 20 times leverage, a 5% move in gold against a trader's position would eliminate 100% of the capital risked, Hamilton wrote. He contrasted that with U.S. stock-market leverage, which has been legally capped at two times since 1974. Because each dollar deployed in gold futures can exert far more price impact than a dollar invested outright, coordinated buying or selling by speculators can produce large moves in gold prices.
Hamilton also noted that the U.S. gold-futures price serves as the global reference price for gold, meaning futures activity can affect broader sentiment and investment flows. Futures-driven rallies may encourage investors to buy, while futures-led declines may cause investors to turn more bearish and exit positions, he wrote.
Speculators' positions are reported weekly in the Commodity Futures Trading Commission's Commitments of Traders reports. The CFTC has published CoT data in various forms since the 1970s, and the reports are widely followed by commodities analysts and traders as a primary tool for gauging positioning across futures markets. The gold-futures CoT reports reflect positions as of each Tuesday's close but are not released until late Friday afternoon, leaving the data both low-resolution and lagging, Hamilton said.
In the slightly more than six weeks since early June, gold recorded six daily declines of more than 2%, averaging 2.9% losses. Those were partly offset by three daily gains of more than 2%, averaging 2.7%. In the six latest CoT reports available before the article's publication, current through July 14, gold's weekly CoT-period moves were -5.2%, +1.7%, -5.2%, -2.2%, +2.2% and -1.4%.
Hamilton said larger CoT-week moves of more than 2% in gold are normally accompanied by speculator futures trading in the same direction. Speculator buying or selling becomes significant when it exceeds 20,000 contracts in one direction during a single CoT week, he wrote. Adding longs and covering shorts tend to lift gold, while selling longs or adding shorts tend to pressure it lower.
As an example, Hamilton cited early September 2025, when gold rose 4.3% in a single CoT week during what he described as a record cyclical bull market. Speculators bought 40,000 long contracts, partly offset by 17,000 new short contracts. The net buying of 22,900 contracts was equivalent to 71.3 metric tons of gold. Gold also posted a 2.6% daily gain during that week.
He also pointed to early February 2026, when gold fell 4.2% in one CoT week after reaching extremely overbought levels. That move was driven by speculators selling 43,700 long contracts while covering 3,200 short contracts, resulting in net selling of 40,500 contracts, or 126.0 metric tons of gold-equivalent exposure.
Hamilton said that historical relationship has recently weakened, especially over the past six-plus weeks and also since mid-February. He said gold's recent volatility has occurred while speculator longs have stayed relatively flat near secular lows, creating what he called an anomaly.
In his view, sharp intraday moves in gold are usually tied to clear news catalysts that futures traders react to quickly. For decades, he said, those catalysts were mostly major U.S. economic data releases seen as affecting the Federal Reserve's likely rate path, as well as Federal Open Market Committee decisions and comments from top Fed officials. Gold has historically tended to move inversely to real interest rates, which is why data and events perceived to shift the Fed's policy stance can trigger rapid price reactions. During Donald Trump's second term, Hamilton said, Trump's Truth Social posts and press conferences have also triggered moves.
Hamilton said gold fell 3.7% on June 5 after a large upside surprise in monthly U.S. jobs data boosted expectations for Federal Reserve rate hikes. Gold dropped 1.8% within half an hour of the data release. He argued that investment capital flows do not usually move that quickly, while highly leveraged gold-futures speculators do. Yet in the CoT week spanning that jobs report, when gold fell 5.2%, net speculator gold-futures selling was only 5,300 contracts, or 16.5 metric tons, which Hamilton said was too small to explain the decline.
A similar pattern appeared later in June, according to the article. Hamilton wrote that Trump's new Federal Reserve chair was hawkish on inflation while leading his first FOMC meeting, triggering selling that pushed gold down another 5.2% during that CoT week. Gold rallied into the FOMC decision but then dropped 2.3% within minutes. Hamilton said such a rapid decline could only have been driven by gold futures. Gold then fell for five consecutive trading days, including four days in that Fed-related CoT week. However, the CoT report showed speculators added 1,200 long contracts and sold short only 3,400 contracts, for net selling of 2,200 contracts, or 6.7 metric tons of gold-equivalent exposure.
Hamilton said he also tracks gold investment flows from U.S. stock investors through the bullion holdings of the GLD, IAU and GLDM gold exchange-traded funds. These ETFs, which hold physical gold in vaults and are among the largest such vehicles globally, allow equity-market investors to gain gold exposure without trading futures. During the same Fed-related CoT week, those ETFs' bullion holdings rose slightly by 0.2%, or 4.0 metric tons, he wrote.
Hamilton also cited a July 13 Truth Social post by Trump, after which gold fell 1.6% within an hour. Trump said that "from this point forward" the United States "will be reimbursed, at the rate of 20% on all cargo shipped" through the Strait of Hormuz "for any and all costs necessary" to keep that chokepoint open. Gold finished that latest reported CoT week down 1.4%. Yet speculators sold 7,600 long contracts and covered 100 short contracts, resulting in net selling of 7,500 contracts, or 23.3 metric tons.
Hamilton said the data shows gold has experienced repeated large declines on news during the past six-plus weeks, but weekly speculator positioning has not reflected the scale of those moves. He said this matters because CoT positioning is often used to assess gold's likely near-term direction.
One possible explanation, Hamilton wrote, is that the weekly CoT schedule is masking intraweek trading. Speculators could sell 20,000 contracts on a news event and buy back 20,000 contracts within the same CoT week, leaving the net positioning data largely unchanged. However, he said this explanation has weaknesses because some large daily moves occurred on Tuesdays, the final day of the reporting week, leaving little time for a reversal before the data cutoff.
Another possibility is that CoT reporting or trader classification has changed, but Hamilton said the last major reported change in CoT trader categories occurred in September 2009. Since then, speculator futures trading has explained most large CoT-week moves in gold until recently. He said a major error in CoT reporting is possible but very unlikely.
Hamilton also suggested that speculators may be avoiding gold-futures trading because the market has become very volatile and the leverage is risky. He said Trump's Truth Social posts are particularly difficult for leveraged traders because they are unpredictable and can occur at any time without warning. At 20 times leverage, a gold move of more than 2% within an hour or two after a Trump post about Iran or peace negotiations could create losses of more than 40% for traders positioned the wrong way, he wrote. Scheduled jobs reports, inflation data and FOMC meetings allow traders to prepare, while what he called "Trump-on-Truth volatility" does not.
If gold-futures speculators are sitting out, Hamilton wrote, other traders may be driving the futures-like sharp moves in other markets. He said this may be the most likely explanation, though it would raise questions about what forces are acting on gold, mostly during U.S. trading hours, and are new enough not to have been apparent in recent decades.
Hamilton said central banks are unlikely to be responsible because their gold buying and selling is typically gradual and tied to very long-term time horizons. He also mentioned the possibility of gold-backed crypto stablecoins trading large amounts of gold outside normal channels, but noted that such products existed before the past six weeks or six months.
Until there is evidence to the contrary, Hamilton said, the CoT data should be treated as legitimate. He argued that low speculator long positions are bullish for gold because they leave leveraged traders substantial room to buy. In late May, before the anomaly intensified, total speculator longs fell to 247,900 contracts, a 3.5-year secular low. In early October 2023, when Hamilton said gold's prior record bull market began, speculator longs were 264,800 contracts. Over the following year, heavy gold-futures buying lifted those positions to 441,000 contracts, which Hamilton described as the dominant early driver of gold's 196.4% rise over 27.8 months.
In the latest reported CoT week, current to the Tuesday before publication, total speculator longs were 271,700 contracts, near levels Hamilton associated with the start of past gold bull phases. He said gold's damaged technical picture could also encourage futures buying if downside volatility eases.
Hamilton said gold fell 2.1% on Thursday, July 16, after news that Iran had asked its Houthi allies, who rule Yemen, to close the Bab-el-Mandeb strait on the opposite side of the Arabian Peninsula from the Strait of Hormuz. He wrote that because Iran had closed Hormuz, Saudi Arabia had been relying on Bab-el-Mandeb to export large amounts of oil while bypassing Hormuz. If the Houthis closed Bab-el-Mandeb, Hamilton said, the already tight global oil market would become much tighter.
That decline extended gold's total drawdown from late January's extreme parabolic highs to 26.3% over 5.5 months. Hamilton said the decline was larger than normal even after gold's biggest cyclical bull markets. Gold also fell to 88.8% of its 200-day moving average that day, which Hamilton said was its most oversold close in 9.6 years.
Speculator short positions were also very low, falling in early June to their lowest levels in 16.8 years, shortly before the recent anomaly worsened, Hamilton wrote. He said this gives speculators room to add shorts as well as longs, but shorts are less important for gold's near-term direction because longs greatly outnumber shorts. Over the previous 52 CoT weeks, total speculator longs averaged 4.4 times total speculator shorts.
Hamilton concluded that American gold-futures speculators have been missing in action for months, with weekly positioning data failing to reflect sharp daily gold moves around news events that looked futures-driven. He said they may have stepped back because heavy leverage, combined with unpredictable Truth Social posts affecting markets, has made futures trading especially risky. He also said their reduced participation has left long positioning near major secular lows, while gold's large drawdown has taken it to its most oversold levels in nearly a decade.
Adam Hamilton, CPA, published the article on July 24, 2026. The article is copyrighted 2000-2026 by Zeal LLC.

