Glassnode's Bitcoin Vector Flips to Risk-On After Recovery Above $70,000
Key Takeaways
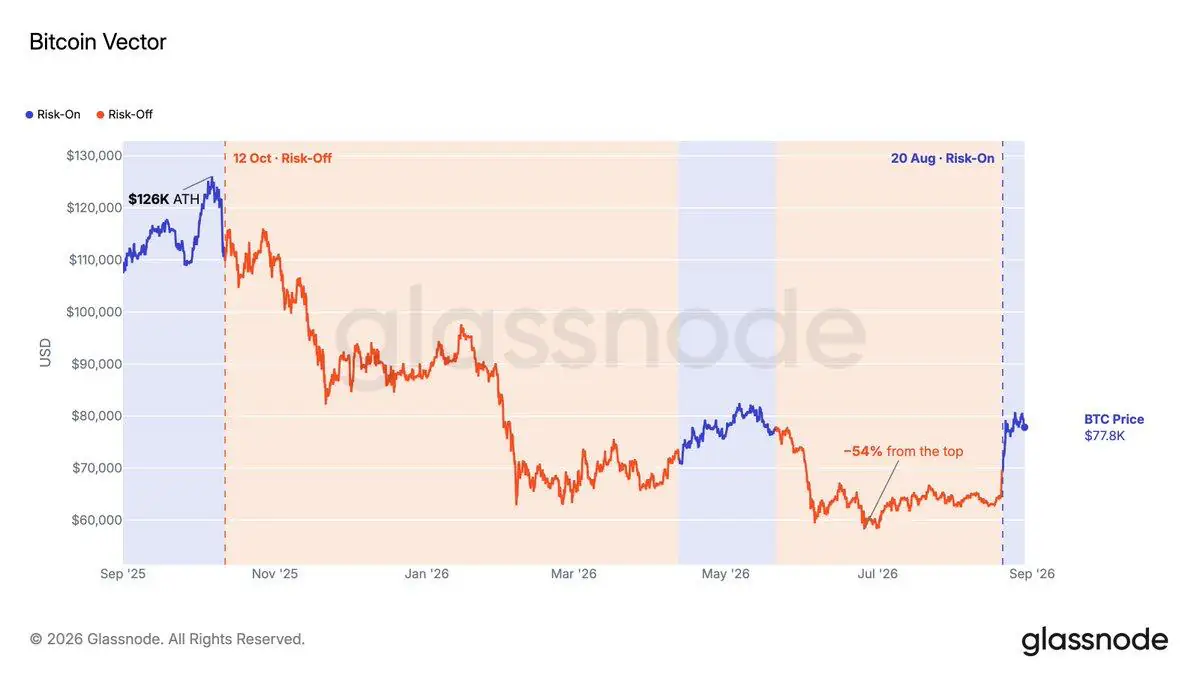
- •Glassnode's Bitcoin Vector returned to a Risk-On regime on August 21 following Bitcoin's move above $70,000, after a Risk-Off inflection dated October 12, 2025.
- •Glassnode's broader Market Compass remained Risk-Off at 14 out of 100, indicating the wider macro and crypto environment is still not supportive.
- •Bitwise Europe identifies the short-term-holder cost basis near $70,200, the True Market Mean near $76,200 and the 200-day moving average near $69,100 as recovered levels, with $83,000 as the last major resistance to confirm a higher high.
- •US spot Bitcoin ETFs recorded approximately $1.92 billion in net inflows across the 10 trading sessions from August 20 through September 2, with eight positive sessions.
- •Sustaining the recovery requires Bitcoin holding above the $76,200 True Market Mean, continued positive ETF flows, and a break above $83,000 driven by spot demand rather than leverage.
A regime change is not an exact top call
Glassnode said its Bitcoin Vector returned to a Risk-On regime after Bitcoin rose above $70,000. The firm's public Vector page dates the previous Risk-Off inflection to October 12, 2025, as Bitcoin began its decline from the $126,000 area. Regime indicators of this type are widely used in crypto analysis because Bitcoin's trend shifts tend to persist, but they are lagging by construction, reacting to conditions that have already changed rather than forecasting them.
That history does not mean Vector identified the precise market top in advance. The model is designed to identify a changing market regime. According to Glassnode, it combines momentum thresholds and capital-flow measures, while recent readings are released after a delay.
The underlying formula is proprietary, so outside readers cannot independently reproduce or fully backtest its signals. The more useful question is whether the conditions behind the new reading are being confirmed by demand and broader market data.
Why the new Vector reading matters
Glassnode lists August 21 as Vector's latest Risk-On inflection. The shift followed Bitcoin's move above $70,000, a level that matters because it placed many recent buyers back above their average entry price. In on-chain analysis, this average is typically tracked through the short-term-holder cost basis, the aggregate purchase price of coins moved or bought in roughly the last 155 days. When price sits below it, recent buyers are underwater and prone to sell into strength; when price sits above it, selling pressure from that cohort tends to ease.
That does not remove profit-taking pressure. Bitcoin still needs new buyers to absorb coins offered by holders who accumulated at lower prices. That was the demand question behind an earlier look at old Bitcoin supply testing the spot market, and it remains central to the recovery.
What the shift means: Glassnode's proprietary Bitcoin framework sees market conditions as supportive enough to move out of a defensive regime.
What it does not mean: It cannot guarantee a straight rally, identify an exact top or prevent Bitcoin from returning to its support levels.
Glassnode's wider market view remains defensive
When checked, Glassnode's broader Market Compass showed 14 out of 100 and Risk-Off. Unlike Vector, the Compass combines seven lenses, including sector performance, Bitcoin's relationship with macro markets, short-term-holder cost basis and global liquidity. The divergence between the two readings reflects how much of Bitcoin's recent improvement is specific to its own price structure rather than to the wider environment, including macro liquidity conditions that crypto markets have repeatedly taken cues from in recent cycles.
The two dashboards ask different questions. Vector assesses Bitcoin's regime, while the Compass measures whether the broader crypto and macro environment is supportive. Together, they describe an improving Bitcoin recovery without showing a market-wide all-clear.
Glassnode's Market Compass is a live daily reading and can change after publication.
Bitwise sees a repaired structure, not a completed breakout
Bitwise Europe's September Bitcoin report is constructive, but it sets a higher bar for confirmation. André Dragosch, Bitwise Europe's head of research, wrote that a new bull market is likely intact as long as Bitcoin holds its reclaimed pricing levels.
Bitwise identifies the short-term-holder cost basis near $70,200, the True Market Mean near $76,200 and the 200-day moving average near $69,100 as important recovered areas. The True Market Mean is an on-chain measure intended to approximate the average cost basis of active investors, filtering out dormant long-held supply, while the 200-day moving average is one of the most widely watched long-term trend indicators in Bitcoin markets. It also describes $83,000 as the last major hurdle: a decisive break above it would establish a higher high and confirm that the previous lower-high pattern has been reversed.
Recovery evidence: Bitcoin is trading above the recent-holder cost basis, the True Market Mean and its 200-day moving average.
Unfinished test: Bitcoin still needs to clear $83,000 with sustained spot demand instead of a move led mainly by leveraged futures trading. That distinction matters because rallies driven largely by leverage have historically proven more vulnerable to sharp liquidation-driven reversals.
ETF flows provide a broader demand test
The Vector shift needs evidence that buyers, rather than short covering alone, are supporting Bitcoin's recovery. Farside Investors data shows US spot Bitcoin ETFs attracted about $1.92 billion in net inflows across the 10 completed trading sessions from August 20 through September 2. These funds, approved by US regulators in January 2024, have become one of the largest vehicles for institutional and retail Bitcoin exposure, which is why their daily flows are treated as a proxy for fresh demand.
Eight of those 10 sessions were positive. The run included more than $600 million of net inflows on August 20 and was interrupted by two outflow days: $201.9 million on August 28 and $236.5 million on September 1.
That pattern is more meaningful than one green day. It suggests that fresh ETF demand returned during Bitcoin's recovery, even if buyers have not yet shown they can absorb every pullback. The next test is whether inflows remain positive as BTC approaches the $83,000 resistance area.
The practical test is now clear
Bitcoin's new Vector reading describes a market that has recovered important ground. To turn that recovery into a stronger case, three conditions need to hold: Bitcoin should remain above the $76,200 True Market Mean, ETF demand should stay positive across multiple sessions and price should clear the $83,000 resistance area without an excessive build-up in leveraged positioning.
If Bitcoin loses those conditions, the model will still have captured a meaningful improvement from the Risk-Off period. It just will not have settled the larger question of whether Bitcoin's recovery can develop into a durable new uptrend.

