GDXJ Gold Miners Post Second-Best Quarter Ever as Costs and Prices Drive Record Unit Profits
Key Takeaways
- •The GDXJ top 25's Q2 2026 bottom-line profits rose 59.4% year over year to $4,142 million, the third-best result on record, on revenues of $13,379 million.
- •Implied unit earnings reached $3,214 per ounce in Q2 2026, the second-highest ever, driven by a quarterly-average gold price of $4,512 that rose 37.3% YoY despite gold's 14.1% intra-quarter plunge.
- •Average trailing P/E ratios fell to 16.1x, the lowest valuation in at least 41 quarters, while cash treasuries hit a record $17,966 million, up 45.2% YoY.
- •The GDXJ top 25's reported average all-in sustaining costs fell 5.1% YoY to $1,298 per ounce, though this was heavily distorted by Buenaventura's negative AISCs; excluding BVN, AISCs averaged a record $1,794, up 20.6% YoY.
- •GDXJ declined only 18.2% in Q2 against gold's 14.1% drop, unusually mild 1.3x downside leverage, and the author expects profit growth to continue into Q3 given quarter-to-date gold prices around $4,159.
Smaller mid-tier and junior gold miners have just finished reporting another spectacular quarter — their second-best ever, according to Adam Hamilton of Zeal LLC. Despite gold plunging in a serious drawdown during Q2 proper, its smaller miners still earned near-record profits. That windfall, combined with gold-driven stock-price declines, pushed valuations to their lowest levels in at least a decade, which the author argues represents exceptional fundamental strength in the sector.
The leading mid-tier gold-stock benchmark is the GDXJ VanEck Junior Gold Miners ETF. With $9.2b in net assets midweek, it remains the second-largest gold-stock ETF after its big-brother GDX — also run by VanEck — which is dominated by far larger major gold miners, though there is significant overlap between the two ETFs' holdings. Despite its name, GDXJ is overwhelmingly a mid-tier gold-stock ETF, with juniors holding lesser weightings.
Gold-stock tiers are defined by miners' annual production rates in ounces: small juniors produce under 300k, medium mid-tiers run 300k to 1,000k, large majors yield over 1,000k, and huge super-majors exceed 2,000k. In quarterly terms, these thresholds translate to under 75k, 75k to 250k, 250k+, and 500k+. Today only five of GDXJ's 25 biggest holdings are true juniors — companies that not only mine less than 75k ounces per quarter but also derive over half of quarterly revenues from gold output. This excludes streaming and royalty companies that purchase future gold output for large upfront payments financing mine-builds, as well as primary silver miners producing byproduct gold.
Mid-tiers often make better investments than juniors, the author notes. The miners dominating GDXJ offer a mix of sizable diversified production, strong output-growth potential, and smaller market capitalizations suited to outsized gains. Mid-tiers are less risky than juniors while amplifying gold uplegs more than majors. Zeal, the author's firm, has specialized in trading these smaller gold miners for over a quarter-century.
Gold's Brutal Quarter, Miners' Mild Response
Q2'26 proved brutal for gold, and most traders overlooked that gold stocks continued to thrive. Gold collapsed 14.1% within the quarter — its worst since Q2'13 — suffering a serious drawdown after its monster record bull run shot near-parabolic in late January. The heavy selling was exacerbated by an ongoing backward war trade and irrational Fed-rate-hike fears.
Such a thrashing should have gutted smaller gold miners, which tend to amplify material gold moves by 3x to 4x or more. Yet GDXJ lost only 18.2% in Q2 proper — astoundingly mild 1.3x downside leverage. The broader reckoning saw gold drop 26.3% from late January to mid-July, with GDXJ's roughly parallel losses peaking at 41.3%, amplifying gold by just 1.6x. At the usual 3x to 4x, the drawdowns would have been catastrophic.
The author cites two reasons for this relative strength. First, during gold's preceding record 196.4% cyclical bull run from early October 2023 to late January 2026, GDXJ underperformed: its 406.6% gains leveraged gold only 2.1x. Having not enjoyed normal upside, the smaller miners did not need to suffer normal downside. Second, experienced gold-mining investors knew Q2 results would again prove spectacular — a prediction Hamilton laid out in an early-July essay (goldseek.com). Anomalously low valuations hindered severe selling.
The GDXJ Top 25 in Q2'26
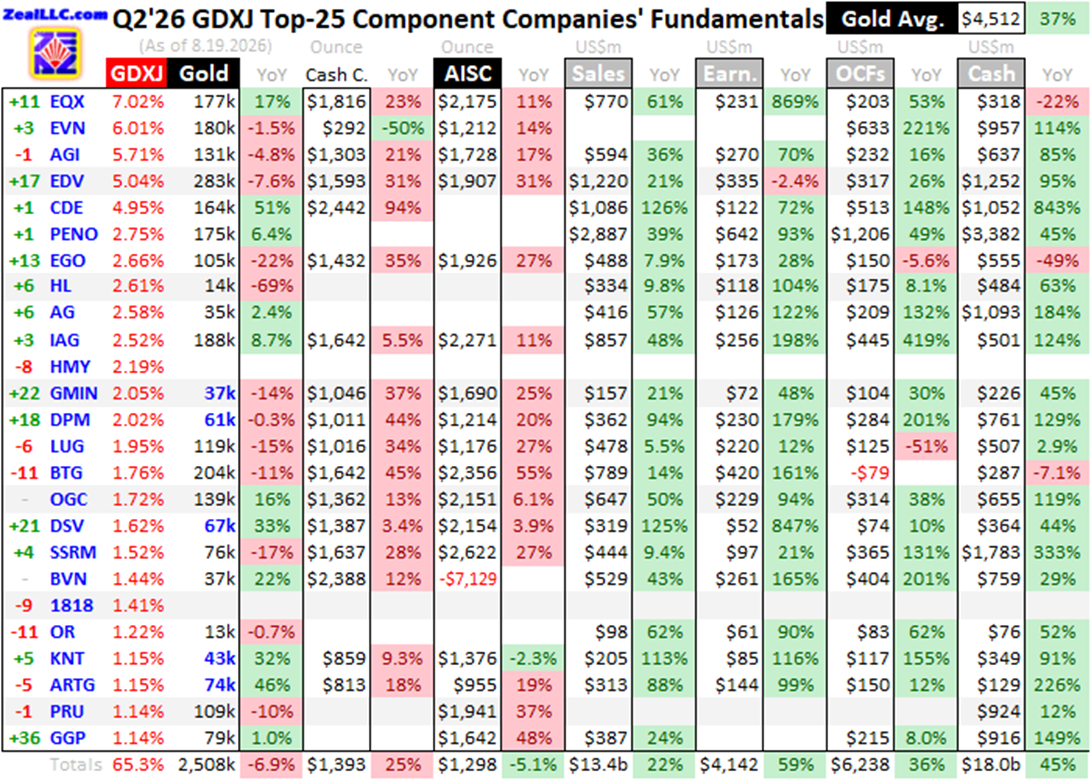
For 41 consecutive quarters, the author has analyzed the operational and financial results of GDXJ's 25-largest component stocks. Mostly mid-tiers, they now account for 65.3% of the ETF's total weighting. The analysis covers ETF ranking changes over the past year, current weightings, Q2'26 production in ounces with year-over-year changes, per-ounce cash costs and all-in sustaining costs, and accounting data reported to securities regulators: revenues, earnings, operating cash flows, and cash treasuries. Blank fields indicate data not yet disclosed as of midweek; YoY changes are omitted where misleading (such as comparisons involving negative numbers).
The key to gold miners bucking gold's horrible Q2 was average gold prices. While the metal plummeted 14.1% within the quarter, its quarterly-average price still soared 37.3% YoY to $4,512 — the second-highest ever after Q1. This dynamic is a structural feature of the mining business: because costs are largely locked in over quarter-to-quarter horizons, miner profitability tracks the average price realized during the period rather than its endpoint. When gold is high, its miners earn heavily.
Unlike GDX, GDXJ's top holdings are dynamic: mid-tiers and juniors with new mines or major expansions can climb into its upper ranks on soaring market caps. There is also large overlap — GDXJ's 13 largest components are all GDX-top-25 stocks, and the entire GDXJ top 25 is included in GDX. Accounting for 65.3% of GDXJ's weighting, they represent 27.7% of GDX's. GDXJ effectively removes GDX's ten largest components (super-majors and majors) and expands the weighting of the next biggest from just over a quarter to nearly two-thirds.
Occasionally the ETFs' common manager removes a larger miner from GDXJ to be exclusively in GDX, as happened this past year. Pan American Silver (PAAS) was GDXJ's largest holding for three quarters in a row into Q4'25. Despite mining 6,469k ounces of silver in Q2'26, PAAS remains a primary gold miner — its 166k ounces of gold drove fully two-thirds of revenues. Now GDX's 9th-largest component, its presence in Q2'25 results but absence in Q2'26 skews most comparisons.
A second major silver-and-gold miner, Mexico's Fresnillo (FRES), was also removed from GDXJ's upper ranks. Now only in GDX, it produced 155k ounces of gold last quarter plus 10,928k ounces of silver; gold drove only four-tenths of its Q2 revenues.
Last quarter the GDXJ top 25 produced 2,508k ounces of gold, down 6.9% YoY. Had PAAS and FRES remained instead of GDXJ's 24th- and 25th-largest components, aggregate production would have run 2,640k ounces, down only 2.0% YoY. That compares with a 10.4% YoY slide for the GDX top 25 majors — an at-least-41-quarter low. Smaller gold miners beat larger ones.
Why Mid-Tiers Outperform
Mid-tiers run smaller stables of typically one-to-four gold mines, so expansions and new mine-builds move the needle on production growth. They overcome depletion more easily than larger peers and consistently achieve output growth as a group. Production growth is essential because it generates the cashflows to expand existing mines and build or buy new ones. Surprisingly, mid-tiers often have lower mining costs than majors despite the latter's supposed economies of scale, making them more profitable relative to production.
Mid-tiers also have lower market caps: the GDXJ top 25 averaged just $10.8b this week, about one-third of the GDX top 25's $31.1b average last week. Smaller caps carry less price inertia and need less capital inflow to rise, so when gold powers higher, mid-tiers and juniors tend to outperform. GDXJ typically amplifies major gold moves 3x to 4x+, versus GDX's 2x to 3x. The author's in-depth analysis of the GDX top 25's Q2'26 results (goldseek.com) preceded this piece.
Costs: Cash Costs and AISCs
Unit gold-mining costs are generally inversely proportional to production levels because mines' operating costs are largely fixed once nameplate plant capacities are set during pre-construction planning. The primary variable driving quarterly output is ore grades fed into plants; richer ores spread fixed costs across more ounces, lowering unit costs. Variable costs, however, have been hit hard by recent years' inflation.
Cash costs include all cash expenses to mine each ounce but exclude exploration and mine-building capital, so they are best viewed as survivability acid-test levels. Last quarter the GDXJ top 25's average cash costs soared 24.8% YoY to $1,393 — the second-highest ever after Q1'26's $1,441. One outlier skewed this: Coeur Mining (CDE), which bought out mid-tier New Gold and ascribed $140m of the purchase price to inventory. Without that accounting treatment, CDE's cash costs would have been $1,608, dragging the GDXJ-top-25 average down to $1,344, up a milder 20.4% YoY. Both figures remain worse than the GDX top 25's adjusted average cash costs, which climbed only 8.4% YoY to $1,286.
Interestingly, the biggest driver of higher cash costs was higher gold prices themselves, because many mines pay royalties based on the value of gold produced. IAMGOLD (IAG) reports costs with and without royalties: its Q2 cash costs were $1,642 with royalties versus $1,289 without — royalties fueled over one-fifth of IAG's cash costs.
All-in sustaining costs (AISCs), introduced by the World Gold Council in June 2013 as a standardized framework to make miner cost reporting comparable across the industry, add to cash costs everything needed to maintain and replenish operations at current output tempos, providing a better picture of true operating profitability. Yet as the Buenaventura case below shows, the standard still leaves room for byproduct accounting to distort cross-company comparisons.
Astoundingly, the GDXJ top 25's average AISCs fell 5.1% YoY to just $1,298 per ounce — trouncing the GDX top 25's $1,788 (up 25.6% YoY) — and marking only the second quarter in the last 41 where AISCs were lower than cash costs. The author attributes this to an extreme anomaly: Peru's Buenaventura (BVN), a polymetallic miner in which gold drove less than one-third of Q2'26 revenues, credits its much larger silver, copper, zinc, and lead production as gold byproducts, gutting its reported AISCs. One BVN mine yielded 13.4k metric tons of copper and 371k ounces of silver in Q2 with negligible gold, yet the company reported that mine's gold AISCs at -$42,588 per ounce, dragging its overall AISCs to an absurd -$7,129 per ounce. BVN also declared Q2'26 copper AISCs of -$11,656 per metric ton. Despite the distortion, the author includes all reported data for consistency across the 41-quarter research history; BVN has reported negative AISCs for years.
Excluding BVN, the rest of the GDXJ top 25 averaged record $1,794 AISCs in Q2'26, up 20.6% YoY from Q2'25 ex-BVN — in line with the GDX top 25's $1,788. BVN has fallen to 33rd place in GDX as of last week.
The mid-tiers are projecting lower AISCs in H2: Q1 and Q2 averaged $1,844 and $1,794 ex-BVN, while full-year 2026 guidance midpoints average $1,727. With H1 running $92 above that, H2 would need to come in a similar amount below to hit guidance, aided by back-half-weighted output boosts many mid-tiers are guiding to.
More relevant than absolute AISCs is their ratio to gold prices. In Q2'26 the BVN-skewed $1,298 average fell to a record-low 28.8% of gold, slightly better than Q1'26's 29.5%. In the five years before the record gold bull began in Q4'23, that ratio averaged a far higher 68% — meaning the sector's margin cushion per ounce is far wider than historical norms, even after the surge in costs.
Record Unit Earnings
The author's preferred metric — implied unit earnings, the quarterly-average gold price minus the GDXJ-top-25 average AISC — came to $3,214 in Q2'26, the second-best on record behind Q1'26's $3,437, soaring 67.6% YoY. Over the last twelve consecutive quarters ending Q2'26, implied unit earnings have grown 106%, 133%, 63%, 63%, 71%, 95%, 91%, 79%, 82%, 102%, 131%, and 68% YoY respectively.
The trend may continue. Over halfway through Q3'26 midweek, gold is averaging $4,159 this quarter despite the drawdown bottoming at $3,973 in mid-July — well above the $1,727 full-year AISC guidance average (which requires Q3 and Q4 to average just $1,635 to offset H1 overages). Assuming conservatively that Q3 AISCs come in around $1,700, profits would still grow about 18% YoY; if BVN remains in the top 25, average AISCs will be skewed lower still. With gold rallying strongly in August, the Q3 average could exceed the quarter-to-date figure.
Hard Accounting Results
The GDXJ top 25's Q2'26 GAAP-equivalent results were also excellent, though dampened by the removal of Pan American Silver and Fresnillo:
- Revenues: grew 22.5% YoY to $13,379m, the fourth-highest on record. With PAAS and FRES instead of the current 24th and 25th components, sales would have risen 44.7% to $15,807m.
- Bottom-line profits: soared 59.4% YoY to $4,142m, the third-best ever; the PAAS/FRES swap would have lifted them to a record $5,179m, up 99.3% YoY. Average trailing-twelve-month P/E ratios fell to just 16.1x — the lowest valuations in at least the last 41 quarters.
- Operating cash flows: surged 36.3% YoY to $6,238m, the third-highest; adjusted for PAAS and FRES, $7,091m, up 55.0% YoY.
- Cash treasuries: soared 45.2% YoY to a record $17,966m — or 63.2% to $20,193m with the PAAS/FRES adjustment — leaving smaller gold miners with vast funds to grow production, an unusual balance-sheet position for a sector historically prone to overextending during upcycles.
Conclusion
The bottom line, per the author: smaller gold miners just reported their second-best quarter ever. Despite gold's serious Q2 reckoning after its record bull run, miners continued earning heavily, with gold still high enough to fuel near-record unit profits and drive valuations to their lowest levels in at least a decade — and likely ever. The twelve-consecutive-quarter streak of enormous profits growth is not over: still-lofty quarter-to-date average gold prices in Q3, combined with miners guiding to lower costs, point to more windfall earnings ahead. GDXJ's recent breakout, the author argues, suggests investors are beginning to recognize this.
Adam Hamilton, CPA, August 21, 2026. Copyright 2000–2026 Zeal LLC (www.ZealLLC.com). Source: GoldSeek.
