Gold Mid-Tiers Report Second-Best Quarter Ever in Q2 2026
Key Takeaways
- •The GDXJ top 25 mid-tier gold miners reported their second-best quarter on record in Q2'26, with bottom-line earnings rising 59.4% year over year to $4.142 billion.
- •Although gold fell 14.1% during the quarter, the quarterly-average gold price rose 37.3% year over year to $4,512, lifting implied unit earnings to $3,214 per ounce, the second-highest on record.
- •The group's revenue increased 22.5% year over year to $13.379 billion, operating cash flow climbed 36.3% to $6.238 billion, and cash on hand reached a record $17.966 billion.
- •Gold production fell 6.9% year over year to 2.508 million ounces, with year-over-year comparisons distorted by the removal of Pan American Silver and Fresnillo from GDXJ.
- •Strong earnings combined with weaker share prices pushed the GDXJ top 25's average trailing P/E ratio down to 16.1x, its lowest level in at least 41 quarters.
Gold Mid-Tiers’ Q2’26 Fundamentals
Adam Hamilton
Smaller mid-tier and junior gold miners have just reported another spectacular quarter, their second-best on record. Even though gold suffered a steep drawdown in the second quarter itself, the smaller miners still generated near-record profits. Combined with gold-driven declines in share prices, that strength pushed valuations to their lowest levels in at least a decade. The result, in the author’s view, is exceptionally strong fundamental support for gold stocks.
The leading benchmark for mid-tier gold stocks is the VanEck Junior Gold Miners ETF, or GDXJ. With $9.2 billion in net assets midweek, it remains the second-largest gold-stock ETF after GDX, its sister fund, the VanEck Gold Miners ETF. GDX is dominated by much larger major gold miners, although the two funds overlap substantially. Despite its name, GDXJ is still overwhelmingly a mid-tier gold-stock ETF, with juniors carrying smaller weightings.
Gold-stock tiers are generally defined by annual gold production. Small juniors produce less than 300,000 ounces per year, medium mid-tiers produce 300,000 to 1,000,000 ounces, large majors produce more than 1,000,000 ounces, and super-majors operate above 2,000,000 ounces. On a quarterly basis, those thresholds translate to under 75,000 ounces, 75,000 to 250,000 ounces, 250,000 ounces and above, and 500,000 ounces and above. Only five of GDXJ’s 25 largest holdings are true juniors.
Juniors not only produce less than 75,000 ounces per quarter, but gold production also accounts for more than half of their quarterly revenue. That excludes streaming and royalty companies that buy future production with upfront capital, as well as primary silver miners that produce gold only as a byproduct. Mid-tiers, however, often offer a more attractive mix of production scale, growth potential, and market capitalization.
The gold miners dominating GDXJ typically have diversified production, strong potential for output growth, and smaller market values that can support outsized share-price gains. Mid-tiers are generally less risky than juniors while still amplifying gold advances more than majors. Zeal has long specialized in these fundamentally stronger mid-tier and junior miners and has actively traded them for more than a quarter century.
Because Q2’26 was so weak for gold, many market participants appear to have overlooked the continued strength in gold stocks. Gold fell 14.1% during the quarter, its worst quarterly performance since Q2’13. The metal was undergoing a needed correction after its late, record-breaking rally turned near-parabolic in late January. Selling pressure was also intensified by the ongoing backward war trade and fears of another Fed rate hike.
A sharp gold decline would normally hit smaller gold miners hard, since they often amplify major moves in gold by three to four times or more. Yet GDXJ fell only 18.2% in Q2, implying just 1.3x downside leverage. Over the broader correction from late January to mid-July, gold fell 26.3% and GDXJ’s losses reached 41.3% at worst, still only 1.6x leverage.
That relative strength has two main explanations. First, during gold’s earlier record 196.4% cyclical bull run from early October 2023 to late January 2026, GDXJ significantly lagged. Although its 406.6% gain was huge in absolute terms, it amounted to only 2.1x leverage to gold. Because the smaller miners did not enjoy normal upside relative to the metal that drives their profits, they did not need to suffer normal downside either.
Second, experienced gold-mining investors had reason to expect excellent Q2 results. Weeks before earnings season began, the author published an essay forecasting near-record quarterly results for gold miners. Their unusually low valuations also limited the severity of the selloff.
For 41 consecutive quarters, the author has analyzed the latest operational and financial results from GDXJ’s 25 largest component stocks. Those holdings are now mostly mid-tiers and account for 65.3% of the ETF’s total weighting. Reviewing these quarterlies is time-consuming, but the process helps cut through the sentiment-driven noise surrounding the sector.
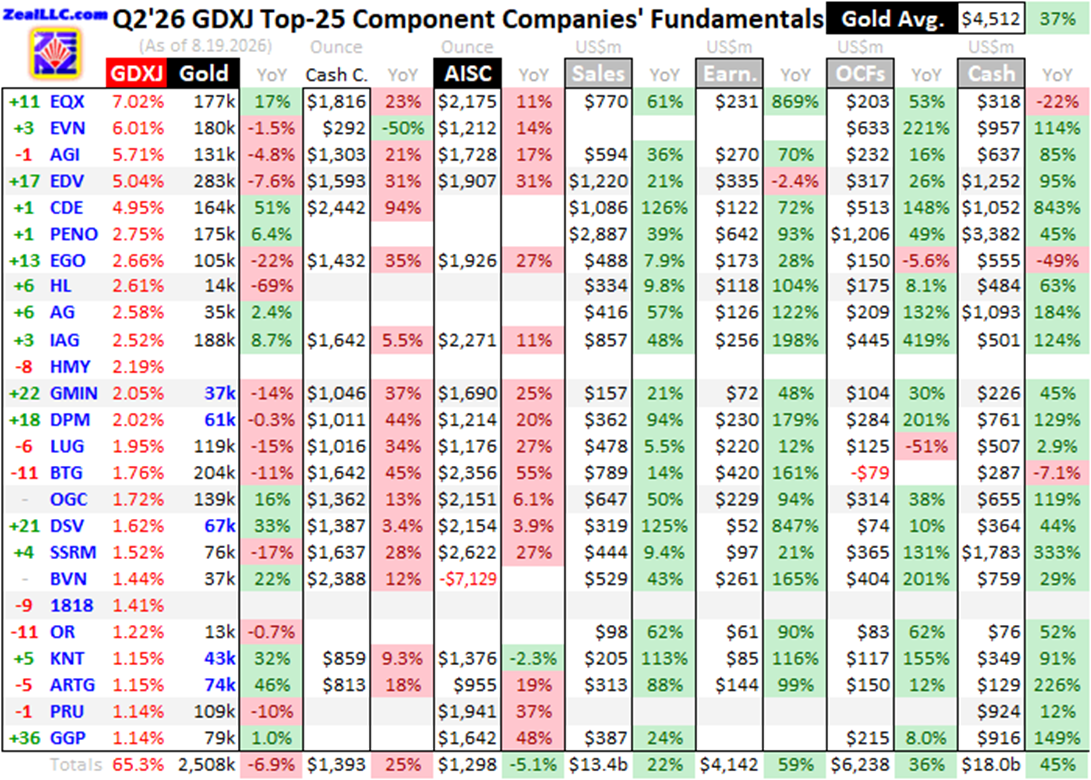
The table described in the source summarizes the GDXJ top 25’s operational and financial highlights for Q2’26. The stock symbols are not all U.S. listings and are preceded by ranking changes within GDXJ over the past year. Those shifts reflect changing market capitalizations and show which miners have outperformed or underperformed since Q2’25. The symbols are followed by current GDXJ weightings.
Next come Q2’26 production figures in ounces and year-over-year changes versus Q2’25. Production is the lifeblood of the gold mining business, and investors generally prize output growth above all else. The table then lists costs per ounce, including cash costs and all-in sustaining costs, which help gauge profitability. It is followed by reported revenues, earnings, operating cash flows, and cash balances. Blank fields indicate companies had not disclosed the data as of midweek. Annual changes are omitted when they would be misleading, such as when values move from positive to negative or vice versa.
The key reason gold miners were able to perform so well in Q2 was the average gold price. Even though gold fell 14.1% during the quarter, the quarterly-average price still rose 37.3% year over year to $4,512, the second-highest in history after Q1. Because miners sell their output continuously at prevailing prices, their revenues and margins track that quarterly average rather than the quarter-end spot level, which is how a steeply falling quarter can coexist with near-record profitability. When gold prices are that elevated, miners can generate exceptional profits.
GDXJ’s top holdings are also more dynamic than GDX’s. Mid-tiers and juniors with new mines or major expansions can quickly climb into the fund’s upper ranks as market capitalizations rise, displacing less dynamic holdings. There is also substantial overlap between the two ETFs. GDXJ’s 13 largest holdings are all in GDX’s top 25, and all of GDXJ’s top 25 are also included in GDX.
Those GDXJ top 25 stocks make up 65.3% of GDXJ’s weighting and 27.7% of GDX’s. In effect, GDXJ removes GDX’s ten largest super-majors and majors and redistributes weight toward the next-largest companies. Occasionally the shared ETF manager, VanEck, removes a larger miner from GDXJ so it is included only in GDX.
That happened this year with Pan American Silver. For three quarters through Q4’25, Pan American Silver was GDXJ’s largest holding. Despite producing 6,469,000 ounces of silver in Q2’26, PAAS remains a primary gold miner because its 166,000 ounces of gold generated two-thirds of revenue. It is now GDX’s ninth-largest component. Because PAAS was in GDXJ’s top 25 in Q2’25 but not Q2’26, comparisons are somewhat distorted.
Fresnillo was also removed from GDXJ’s upper ranks over the past year. The Mexican miner is now included only in GDX. It produced 155,000 ounces of gold in the latest quarter along with 10,928,000 ounces of silver. Gold accounted for only 40% of its Q2 revenue, so it is not a primary gold miner. As with PAAS, its removal from GDXJ complicates year-over-year comparisons.
In Q2’26, the GDXJ top 25 mid-tiers produced 2,508,000 ounces of gold, down 6.9% year over year. If PAAS and Fresnillo had remained in the group instead of the companies that replaced them, the aggregate would have been 2,640,000 ounces, down just 2.0% year over year. That compares favorably with the GDX top 25 majors, whose production fell 10.4% year over year in Q2’26, the lowest level in at least 41 quarters.
Mid-tiers have long outperformed majors. Their smaller operating scale, often just one to four mines, means expansions and new mine builds can materially change production. They tend to overcome depletion more easily than larger peers and often deliver stronger growth as a group. New expansions and mine startups also tend to drive outsized share-price gains.
Production growth matters because it generates the cash flow needed to expand existing mines and build or acquire new ones, which can ultimately support higher stock prices. Mid-tiers also sometimes have lower mining costs than majors, despite majors’ supposed economies of scale. That combination can make them more profitable on a per-ounce basis and support stronger equity performance.
Their smaller market capitalizations are another advantage. The GDXJ top 25 averaged only $10.8 billion this week, roughly one-third of the GDX top 25’s $31.1 billion average. Smaller companies generally have less share-price inertia and require less capital inflow to move higher. When gold rises and sector interest improves, mid-tiers and juniors tend to outperform.
The author previously analyzed the GDX top 25’s Q2’26 results in depth in the prior essay. Comparing the mid-tier-heavy GDXJ with the major-heavy GDX helps explain the outperformance also visible in stock prices. GDXJ tends to amplify major gold moves by 3x to 4x or more, versus GDX’s typical 2x to 3x.
Gold-mining unit costs are generally inversely related to production levels. That is because most mine operating costs are largely fixed once a project is designed and built. Plants do not change capacity quarter to quarter, so infrastructure, equipment, and staffing levels remain broadly similar. The main variable that changes output is ore grade, which can vary significantly even within a single deposit.
Higher-grade ore produces more ounces over which to spread fixed costs, lowering unit costs and improving profitability. But gold mining also involves meaningful variable costs, and the inflation of recent years has increased those pressures.
Cash costs are the standard measure of mining expense. They include the cash outlays required to produce each ounce of gold, but they do not capture the capital needed to explore for deposits or build mines. As a result, cash costs are best viewed as a survivability measure for smaller miners because they indicate the minimum gold price needed to keep operations running.
In Q2’26, the GDXJ top 25’s average cash costs rose 24.8% year over year to $1,393 per ounce, the second-highest on record after Q1’26’s $1,441. One notable outlier was Coeur Mining, which acquired New Gold and assigned $140 million of the purchase price to inventory. Without that accounting treatment, CDE’s cash costs would have been $1,608. That would have lowered the GDXJ top 25 average to $1,344, up 20.4% year over year.
Even with that adjustment, the GDXJ top 25 would still have had higher cash costs than the GDX top 25, whose average cash costs rose only 8.4% year over year to $1,286. A major driver of higher cash costs in the quarter was higher gold prices themselves, since many miners pay royalties based on a percentage of gold revenue.
IAMGOLD provides especially clear disclosure on royalty effects by reporting unit costs with and without royalties. In Q2, its cash costs were $1,642 with royalties included and $1,289 without them. Royalties accounted for more than one-fifth of IAG’s cash costs. Because cash costs including royalties are a major component of broader all-in sustaining costs, they matter greatly in profitability analysis.
All-in sustaining costs, or AISCs, are a much better measure than cash costs and were introduced by the World Gold Council in June 2013. They include everything required to maintain and replenish operations at current production levels. AISCs provide a clearer view of what it really costs to keep a mine functioning as an ongoing concern and therefore offer a better picture of true operating profitability.
In Q2’26, the GDXJ top 25’s average AISCs fell 5.1% year over year to $1,298 per ounce. That was far better than the GDX top 25’s $1,788, which rose 25.6% year over year. It was also only the second quarter in the past 41 in which AISCs came in below cash costs, a result that does not make sense in ordinary circumstances and reflects an extreme anomaly.
The anomaly comes from Peru’s Buenaventura, which continues to report numbers that are difficult to reconcile. BVN is not a primary gold miner, yet it reports in gold-centric terms, likely because gold stocks attract more investor attention and capital than base-metals miners. Gold accounted for less than one-third of Buenaventura’s Q2’26 revenue, but the company still credits much of its larger silver, copper, zinc, and lead production as gold byproducts, which drives its AISCs sharply lower.
In one of its mines, BVN reported 13.4 metric tons of copper and 371,000 ounces of silver, while gold was so negligible it was not even mentioned. Yet the company still claimed gold AISCs of negative $42,588 per ounce for that mine. That helped push Buenaventura’s overall Q2 all-in sustaining costs to an absurd negative $7,129 per ounce. The author says the data must be included because it is what the company reported, even if it is highly distorted.
Buenaventura has reported negative AISCs for years, skewing both GDXJ and GDX averages. Excluding BVN, the rest of the GDXJ top 25 averaged record AISCs of $1,794 in Q2’26, up 20.6% year over year on the same ex-BVN basis. That is broadly in line with the GDX top 25’s $1,788. Buenaventura had fallen to 33rd place in GDX by last week, but its reporting remains questionable. The company also reported negative copper AISCs of $11,656 per metric ton in Q2’26.
The GDXJ mid-tiers appear to be guiding for lower AISCs in the second half of the year. Ex-BVN, the group averaged $1,844 in Q1 and $1,794 in Q2, while full-year 2026 guidance midpoint averages are lower at $1,727. Since first-half AISCs were $92 above that figure, second-half costs would have to run about that much below to hit guidance. Many miners are guiding for back-half production increases that should lower AISCs, and whether those increases arrive on schedule is among the clearest items to watch in the next round of quarterly reports.
More important than absolute AISC changes is the ratio of AISCs to the prevailing gold price. In Q2’26, the GDXJ top 25’s BVN-skewed average of $1,298 translated into a record-low 28.8% of the average gold price, slightly better than Q1’26’s 29.5%. By comparison, in the five years before Q4’23 launched the latest gold bull market, that ratio averaged 68%.
The author says the best measure of gold miners’ collective performance is implied unit earnings, calculated by subtracting average AISCs from the quarterly-average gold price. This is preferred over bottom-line accounting profit because the earnings of the changing GDXJ top 25 can be distorted by large noncash charges or gains.
Using that method, Q2’26 unit earnings were $3,214 per ounce, the second-best on record after Q1’26’s $3,437. That figure rose 67.6% year over year. The past twelve quarters have shown extraordinary year-over-year gains in implied unit earnings, including increases of 106%, 133%, 63%, 63%, 71%, 95%, 91%, 79%, 82%, 102%, 131%, and 68%.
The author argues that no other market sector can match that kind of consistent profit growth. He also says earnings are still rising. Midway through Q3’26, gold was averaging $4,159 per ounce for the quarter despite a drawdown that bottomed in mid-July at $3,973. That remains well above the GDXJ top 25’s full-year AISC guidance midpoint of $1,727. To reach that guidance, Q3 and Q4 would need to average $1,635 to offset the first half’s cost overshoot.
Buenaventura does not provide AISC guidance, so it is excluded from that forecast. Even using a conservative assumption of around $1,700 in Q3 for the GDXJ top 25, the group would still be on track for additional year-over-year profit growth. If BVN remains in the top 25 in the next earnings season, average AISCs would again be pulled lower, potentially boosting reported profit growth further. Gold’s strength in August also means the Q3 average gold price could end up above the current quarter-to-date level.
The GDXJ top 25’s reported accounting results under GAAP or foreign equivalents were also strong, though comparisons were affected by the removal of Pan American Silver and Fresnillo. Revenue rose 22.5% year over year to $13.379 billion, the fourth-highest on record. With PAAS and FRES still included, revenue would have climbed 44.7% to $15.807 billion.
Bottom-line earnings jumped 59.4% year over year to $4.142 billion, the third-best on record. With PAAS and FRES retained, earnings would have reached a record $5.179 billion, up 99.3% year over year. That strength pushed the GDXJ top 25’s average trailing-twelve-month price-to-earnings ratio down to just 16.1x, the lowest in at least 41 quarters, meaning share prices have lagged the sector’s earnings growth rather than anticipating it.
Operating cash flow surged 36.3% year over year to $6.238 billion, also the third-highest on record. Adjusted for PAAS and FRES, operating cash flow would have been $7.091 billion, up 55.0% year over year. Total cash on hand rose 45.2% year over year to a record $17.966 billion, or $20.193 billion with Pan American Silver and Fresnillo included instead of the current 24th and 25th components. Smaller gold miners have substantial resources available to fund growth.
The author says mid-tiers and juniors remain Zeal’s focus because of their fundamental superiority. Over the quarter century through Q2’26, Zeal realized 1,648 stock trades in its weekly and monthly subscription newsletters, mostly in gold and silver stocks. Those trades produced average annualized realized gains of 19.8%, including losers.
The firm continues to search for the highest-production-growth mid-tier and junior miners with major expansions or mine builds approaching startup. Those catalysts can attract additional capital, especially from fund managers. The author argues that eventually more professional investors will recognize the value in this small sector and drive prices much higher.
The article closes by saying the smaller gold miners have just reported their second-best quarter ever. Despite the Q2 gold correction, they continued to earn money at a very high rate. Gold remained high enough to support near-record unit profits, which pushed gold-stock valuations to the lowest levels in at least a decade and likely ever. The author says the sector’s fundamental strength remains remarkable and that the recent breakout in GDXJ suggests investors may already be starting to return.
Adam Hamilton, CPA
August 21, 2026

