Business Cycle Indicators: Real GDP, Personal Income Trajectory Revised Up
Key Takeaways
- •Second-quarter US real GDP growth was revised upward by 0.7 percentage points.
- •Personal income excluding transfers moved higher due to a revised deflator and now stands 1.6% above its January 2025 level, whereas the previous release indicated that level had not been reattained.
- •Because the NBER Business Cycle Dating Committee weighs these series when dating peaks and troughs, revisions of this size can change how the economy's recent course is interpreted.
- •The latest statistics sharpen the gap between output and income measures on one side and employment indicators on the other, making upcoming employment data the immediate focus for cycle observers.
- •Consumption grew at a preliminary annualized 6.6% pace in August, reinforcing the view that survey-based consumer sentiment, currently at deep lows, is not necessarily informative about actual spending.
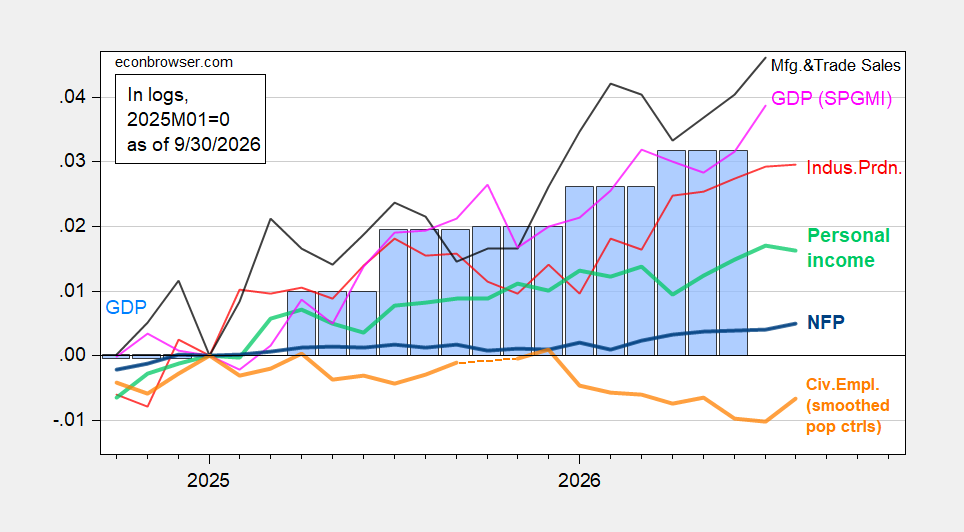
Key economic indicators followed by the National Bureau of Economic Research's (NBER) Business Cycle Dating Committee — the panel that sets the official dates of US business cycle peaks and troughs — have shifted upward, as second-quarter real GDP growth was revised up by 0.7 percentage points and the path of personal income excluding transfers moved higher owing to a revised deflator. Because the committee weighs these very series when identifying turning points, revisions of this size can change how the economy's recent course is read.
Figure 1: NFP employment (bold blue), civilian employment with smoothed population controls (bold orange), industrial production (red), personal income excluding current transfers in Ch.2017$ (bold light green), manufacturing and trade sales in Ch.2017$ (black), and monthly GDP in Ch.2017$ (pink), GDP (blue bars), all log normalized to 2025M01=0. Source: BLS via FRED, BLS, Federal Reserve, BEA 2026Q2 3rd release, S&P Global Market Insights (nee Macroeconomic Advisers, IHS Markit) (9/2/2026 release), and author's calculations.
Under the previous release of real personal income, January 2025 levels had not been reattained. As of the latest release, this measure stands 1.6% above its January 2025 level — a swing that shows how substantially later estimates can reframe the picture of household economic conditions.
The gap between output and income measures, on one side, and employment indicators on the other is hence thrown into yet sharper relief by the latest statistics. For observers of the cycle, the immediate item to watch is whether upcoming employment data bring those divergent series back into line.
Alternative indicators also buttress the argument for strong output growth.
Figure 2: Civilian employment adjusted to NFP concept smoothed population controls, using experimental controls for 2025 (bold orange), manufacturing production (red), ADP private nonfarm payroll employment (light green), real retail sales, CPI deflated (black), freight services indexes (brown), and coincident index in Ch.2017$ (pink), GDO (blue bars), all log normalized to 2025M01=0. Source: BLS, ADP via FRED, Philadelphia Fed, Bureau of Transportation Statistics, Federal Reserve via FRED, BEA 2026Q2 3rd release, and author's calculations.
The boom in consumption is notable. Consumption grew at an annualized 6.6% pace in August. Although this is a preliminary figure, and the second-quarter GDP revision shows how far later estimates can travel from initial ones, it reinforces the view that survey-based assessments of consumers' mood — at deep lows right now — are not necessarily informative regarding actual consumption.
Source: Econbrowser

