FOMC Minutes, Canada CPI, and USD/CAD Technical Outlook
Key Takeaways
- •The July FOMC minutes, scheduled for release on August 19, follow a 9-3 vote by the Federal Reserve to keep its benchmark target range at 3.50%-3.75%.
- •The July policy discussion took place before the August 7 payrolls report, which showed slowing hiring and an unexpected loss of 23,000 jobs.
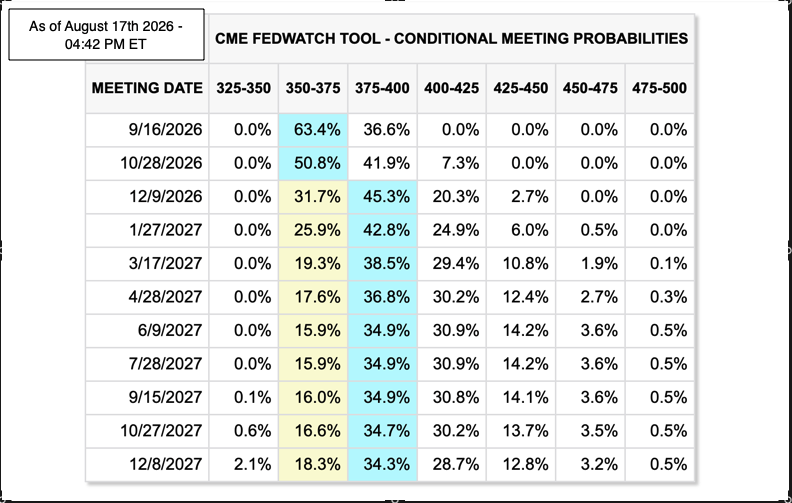
- •Traders assign a 63.4% probability that rates remain at 3.50%-3.75% at the September 16, 2026 meeting, with expectations shifting toward the 3.75%-4.00% range by December.
- •Canada's annual CPI accelerated to 3.0% in July from 2.8% in June on higher energy costs, while core measures stayed subdued and the Bank of Canada is expected to hold its 2.25% policy rate on September 2.
- •USD/CAD broke below key supports including the monthly pivot at 1.4081 and the weekly pivot at 1.3901, and its 14-period RSI stands in oversold territory at 29.24.
Market participants are awaiting the release of the July Federal Open Market Committee (FOMC) minutes on Wednesday, August 19, for greater clarity on the Federal Reserve’s thinking after its 9–3 decision to keep the benchmark target range at 3.50%–3.75%.
Because the discussion took place before the August 7 non-farm payrolls (NFP) report, analysts will focus on whether the minutes point more strongly to persistent inflation risks or to cooling labor market momentum. The July employment report showed slowing hiring and an unexpected loss of 23,000 jobs, raising questions about how the Fed may weigh growth and inflation ahead of its September meeting. The minutes may also help clarify how divided policymakers were in July, which matters because the Fed’s next rate decision will be shaped not only by fresh data but by how officials interpret the balance of risks already visible in the economy.
Gain unique insights through live market analysis with OANDA’s market experts:
Market expectations for Federal Reserve policy rates
As of August 17, 2026, expectations for Federal Reserve policy rates continue to reflect a higher-for-longer backdrop, supported by persistent inflation concerns and economic resilience. According to the CME FedWatch Tool, traders are pricing in conditional meeting probabilities that favor either holding rates steady or making only modest adjustments to the benchmark target range.
For the September 16, 2026, meeting, the market is pricing a 63.4% probability that the target rate will remain in the 350–375 basis points (3.50%–3.75%) range, while there is a 36.6% probability that it will move to the 375–400 basis points range. By the December 9, 2026, meeting, the highest probability shifts slightly higher to the 375–400 basis points range at 45.3%, compared with 31.7% for 350–375 bps and 20.3% for 400–425 bps.
Looking further into 2027, market expectations remain centered around the 375–400 bps target rate, with probabilities holding near 35% to 43% through late 2027. That pattern suggests that market participants expect limited monetary easing and relatively steady interest rates rather than a return to lower levels.
Canada consumer price index (CPI)
Statistics Canada reported that Canada’s Consumer Price Index (CPI) rose 3.0% year-over-year in July, up from 2.8% in June, as headline inflation accelerated on energy costs. At the same time, the Bank of Canada’s preferred core measures remained broadly subdued, indicating that the increase was driven more by volatile factors than by widespread price pressure.
The CPI-Median edged up to 2.0% from 1.9%, while CPI-Trim held steady at 1.9%. Both measures are designed to filter out extreme price movements and offer a clearer reading of underlying inflation trends.
The acceleration in headline CPI makes an immediate rate cut or rate hike less likely at the Bank of Canada’s September 2 meeting. With Canada’s unemployment rate around 6.5%, raising rates in a cooling labor market to counter oil-related inflation risks could increase the risk of over-tightening. According to the Montreal Exchange, the Bank of Canada is expected to keep its policy rate unchanged at 2.25%.
USD/CAD daily chart technical analysis
After breaking below an ascending channel in early 2025, USD/CAD traded within a narrowing formation marked by red lines on the chart. Price action continued to respect the formation’s lower and upper boundaries through June 2026.
In May 2026, the pair began a sharp upward move, marked by the black line on the chart. In June 2026, price broke above the upper boundary of the narrowing pattern and reached a high of 1.4240. In July, however, the pair broke back below the trend and completed a pullback to its extension, followed by a steep decline that pushed through several key support levels.
That move took USD/CAD below the monthly pivot point at 1.4081, the monthly S1 at 1.3923, the weekly pivot point at 1.3901, the fast EMA9, and the intermediate SMA 50. Those levels now help frame the current market structure, particularly as traders look ahead to the Federal Reserve minutes and Canada’s inflation backdrop for fresh confirmation of policy divergence or convergence.
At present, price action is trying to hold above a major support confluence formed by the long-term SMA, the monthly S2 at 1.3833, and the weekly S1 at 1.3837. A secondary support area lies below, defined by the extension of the earlier formation’s upper red boundary.
The 14-period RSI is in oversold territory at 29.24, moving in step with the recent decline in price.
Opinions are the authors’ and do not necessarily reflect those of OANDA Business Information & Services, Inc. or any of its affiliates, subsidiaries, officers, or directors. This publication is provided for informational and educational purposes only. For the reproduction or redistribution of content found on MarketPulse, please refer to the MarketPulse Terms of Use.
https://www.marketpulse.com/terms-of-use/
© 2026 OANDA Business Information & Services Inc.

