Fed Bank Reserves Drop $88.236 Billion Between Weekly Snapshots as Weekly Average Rises
Key Takeaways
- •Federal Reserve bank reserves declined by $88.236 billion between the Wednesday snapshots of September 23 and September 30, 2025, as reported in the Fed's H.4.1 release.
- •Despite the snapshot decline, the weekly average of bank reserves rose over the same period, indicating the broader liquidity trend was firmer than the single-day figure suggested.
- •September 30 fell at the end of a calendar quarter, a period when large cash movements between banks, corporations, and the government routinely distort point-in-time reserve comparisons.
- •Bank reserves serve as a proxy for financial system liquidity, and sustained tightening could reduce banks' lending capacity and investors' appetite for risk assets such as Bitcoin.
- •A large drop in a single snapshot reading does not by itself prove a liquidity squeeze is underway, so analysts should watch the weekly average trend across several upcoming H.4.1 releases.
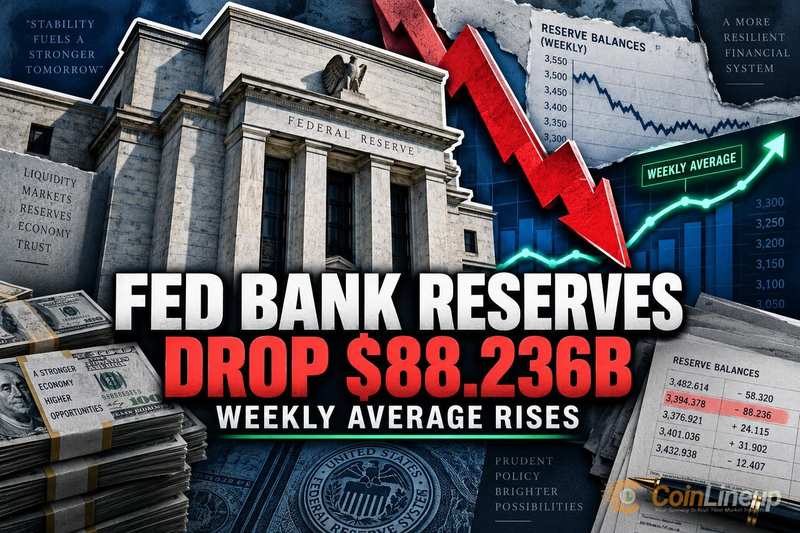
Federal Reserve bank reserves fell by $88.236 billion between the Wednesday snapshots of September 23 and September 30, 2025, according to the Federal Reserve's H.4.1 statistical release. Over the same span, the weekly average of reserves moved higher — a split reading that matters for anyone tracking whether banks hold enough cash on hand to keep lending and liquidity flowing through the financial system. The divergence between the two measures shows how quarter-end dynamics can distort a single day's data even when the broader liquidity picture is steadier.
What the $88.236 billion decline shows
The H.4.1, published by the Federal Reserve each week, tracks assets and liabilities on the Fed's balance sheet. One measure it captures is the level of bank reserves — the money commercial banks hold on deposit at the central bank. Banks draw on those balances to settle payments with one another and to cover day-to-day customer outflows. Reserves sit at the core of the banking system's settlement plumbing and are closely watched as an indicator of how much room lenders have to extend credit.
Between the September 23 snapshot and the September 30 reading, that reserve level declined by $88.236 billion. A snapshot comparison captures a single point in time on each Wednesday, not a smoothed average of the full week.
Single-day readings can swing sharply around quarter-end dates, tax payment deadlines, or Treasury settlement days. September 30 falls at the end of a calendar quarter, a period when large cash movements between banks, corporations, and the government are common. That context is important before drawing conclusions from a single snapshot, because quarter-end flows routinely distort point-in-time comparisons.
Why the weekly average rose at the same time
Despite the snapshot-to-snapshot decline, the weekly average of bank reserves rose over the same period. The weekly average smooths out daily swings by blending readings across the full week, including days before and after the Wednesday snapshot date. The H.4.1 reports the Wednesday level and the weekly average side by side, giving analysts a smoothed trend to weigh against any single point-in-time reading. Because it incorporates trading days on either side of the snapshot date, the average is less sensitive to isolated cash moves tied to a single calendar event.\nThat means reserves appeared lower on the specific Wednesday of September 30 compared with September 23, yet the broader pattern across the week was actually higher. The two measures can move in opposite directions, and neither one alone tells the complete story.
Liquidity watchers, including those tracking conditions relevant to Bitcoin ETF inflows and risk-asset demand, often focus on reserve trends because tighter bank liquidity can reduce appetite for speculative assets. A rising weekly average suggests the underlying reserve cushion remained intact even if the Wednesday reading looked weaker.
What this means for crypto markets
Bank reserves are a proxy for financial system liquidity. When reserves are high and rising, banks tend to lend more freely and investors are more willing to take on risk. When reserves tighten sharply and stay lower, borrowing costs can rise and investors often pull back from higher-risk assets like Bitcoin.
The $88.236 billion drop in the Wednesday snapshot is large on its face. But the rising weekly average is a signal that the underlying trend was not as tight as the single-day figure suggests. As CryptoSlate reported, an $88 billion reserve drop in a snapshot reading does not by itself prove a liquidity squeeze is underway.
Regulatory developments affecting how banks interact with digital assets, such as the ongoing legal disputes over OCC crypto trust-bank rules, add further complexity to how reserve conditions translate into crypto market liquidity.
The practical takeaway: watch the weekly average trend over several weeks rather than reacting to a single Wednesday snapshot. The coming H.4.1 releases will show whether the upward trend in the weekly average holds. One data point, even a large one, is not a reliable signal of where liquidity is heading.
Disclaimer: This article is for informational purposes only and does not constitute financial or investment advice. Cryptocurrency and digital asset markets carry significant risk. Always do your own research before making decisions.

