Ethereum Tests $2,431 Support as Hot US Inflation Weighs on Crypto Market
Key Takeaways
- •US annual producer inflation accelerated to 5.4% in August from 4.8%, raising expectations for tighter Federal Reserve policy.
- •Ethereum is testing support near $2,431 and $2,405, with resistance around $2,545 and longer-term support between $2,223 and $2,256.
- •US spot Ethereum ETFs posted $34.75 million in net inflows on Wednesday, although weekly inflows fell to $218.4 million from a previous high of $824 million.
- •Retail investors sold 307,000 ETH last week, exceeding the 82,000 ETH accumulated by whales.
- •Ethereum’s price has advanced faster than futures open interest, indicating limited fresh commitment from leveraged long traders.
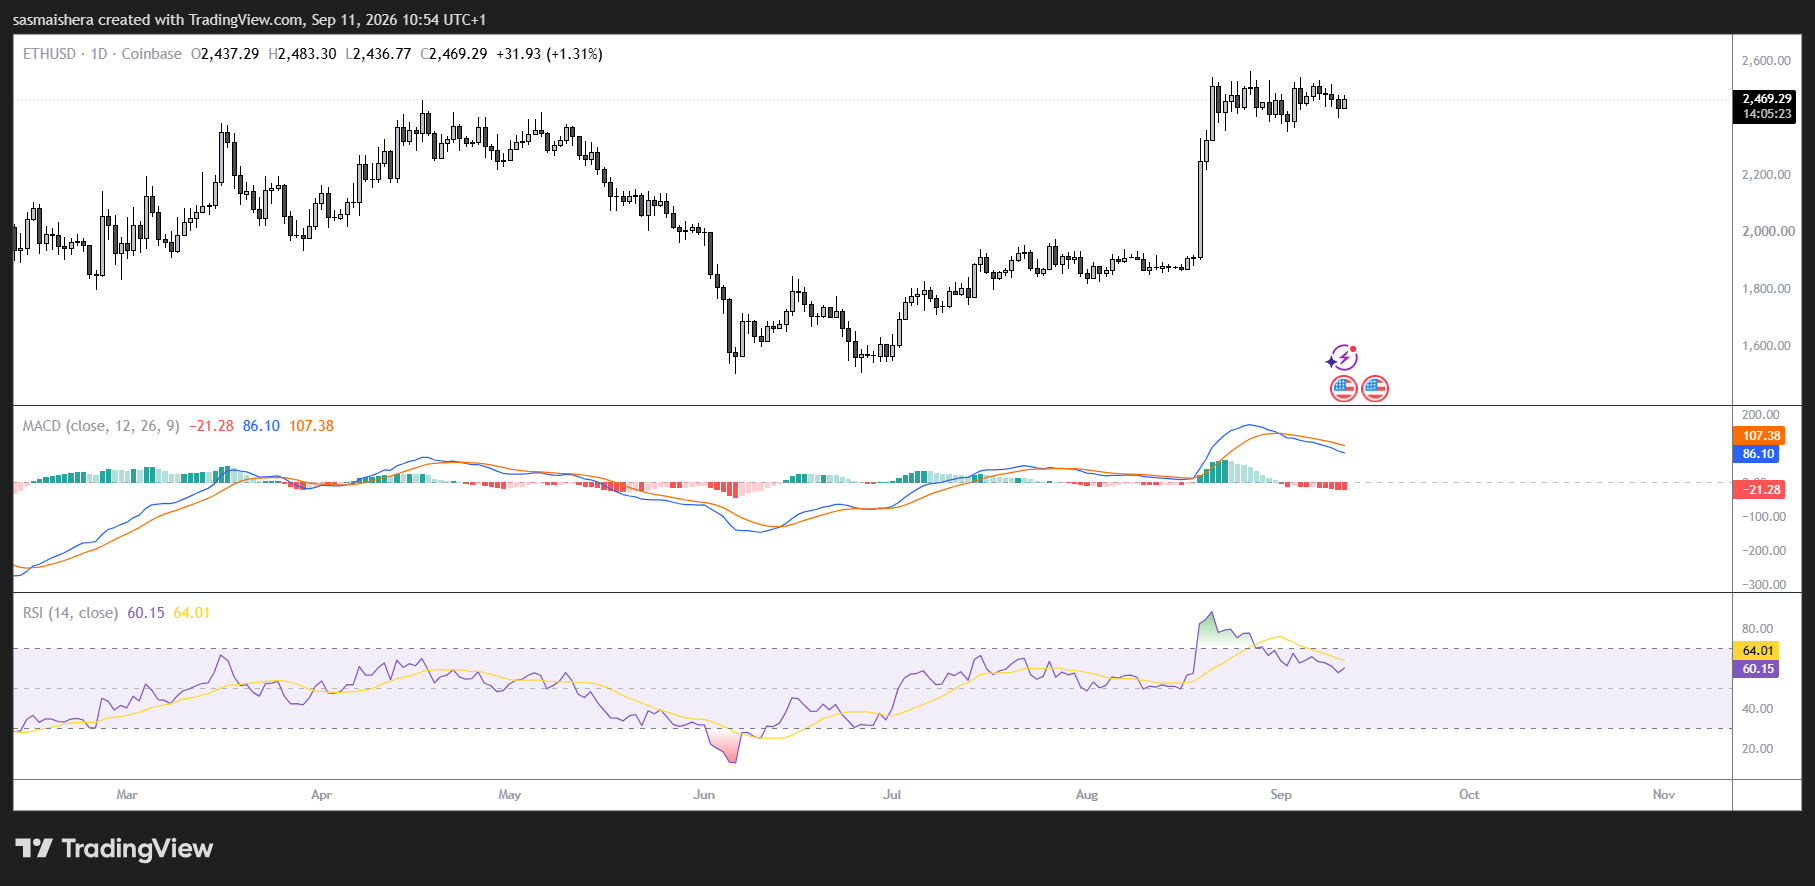
Ethereum (ETH) traded 0.7% lower on Friday while attempting to recover from selling pressure triggered by stronger-than-expected US producer inflation. Annual producer inflation accelerated to 5.4%, increasing expectations of tighter Federal Reserve policy and creating a more challenging environment for risk assets.
Ethereum remains above its major moving averages, but retail selling, cautious derivatives traders, and slowing institutional demand could limit its near-term recovery. ETH is testing support near $2,431 and its 20-day exponential moving average around $2,405, while resistance is located near $2,545.
US producer inflation accelerates to 5.4%
The US Producer Price Index for final demand rose 0.4% in August, matching market expectations after a revised 0.1% increase in July. On an annual basis, producer inflation accelerated to 5.4% from 4.8%.
Energy prices contributed significantly to the increase, rising 4.2% amid higher oil prices. Core producer prices, which exclude food and energy, also advanced 0.4% during the month.
The data came before Friday’s Consumer Price Index report, another potential catalyst for expectations surrounding the Federal Reserve’s September 15–16 meeting. Prediction-market data from Polymarket showed traders assigning a 62% probability to an interest-rate increase at the Fed’s next meeting, while the estimated likelihood of a hike by October stood at 71%.
Markets also increasingly expect Fed Chair Kevin Warsh to begin his tenure with a rate increase, representing a sharp shift from earlier policy expectations. Higher rates could pressure Ethereum by tightening financial conditions and increasing the appeal of interest-bearing assets. They could also discourage the leveraged trading and speculative activity that often support cryptocurrency rallies.
Despite the difficult macroeconomic backdrop, US spot Ethereum exchange-traded funds recorded $34.75 million in net inflows on Wednesday. The inflows offset the $24 million withdrawn on Tuesday and indicated that some institutional investors continued accumulating ETH during its two-week consolidation.
Weekly ETF demand, however, has slowed. The products attracted $218.4 million last week, down sharply from the yearly high of $824 million recorded during the preceding week. The decline suggests that institutional interest remains positive but has lost momentum.
Retail investors sold a combined 307,000 ETH last week, significantly exceeding the 82,000 ETH accumulated by whales. The imbalance indicates that smaller holders have adopted a more cautious approach following Ethereum’s recovery in late August. Persistent retail distribution could increase available supply and limit attempts to push the price higher.
Ethereum’s price has also risen faster than futures open interest. This divergence suggests that leveraged long traders remain reluctant to commit substantial fresh capital to the recovery.
Ethereum tests the 20-day EMA and $2,431 support
Ethereum is testing horizontal support near $2,431 and its 20-day exponential moving average around $2,405. Despite the pullback, ETH remains comfortably above its 50-, 100-, and 200-day EMAs, which are clustered between approximately $2,223 and $2,256. This positioning keeps the broader uptrend intact.
The Relative Strength Index stands near 59, maintaining a modest bullish tilt while showing that momentum has cooled. The Stochastic Oscillator is also moving toward its midpoint, indicating moderation rather than a confirmed bearish reversal.
If Ethereum rebounds, its first major resistance is near $2,545. A decisive close above that level could expose the next barriers at $2,626 and $2,787.
On the downside, losing $2,405 and $2,431 would shift attention to the moving-average support cluster between $2,223 and $2,256. Further support lies at $2,172, followed by the broader trend floors at $1,961 and $1,810.
A sequence of daily closes above the overhead resistance levels would restore stronger bullish momentum and reopen the path toward new local highs.
Source: CoinJournal
