Ethereum Tests Key Support as Network Transactions Reach Record High
Key Takeaways
- •Ethereum broke below its rising channel and is now testing the 0.382 Fibonacci retracement near $1,880 as immediate support.
- •The network is processing approximately 2.5 million transactions per day, close to the highest level recorded in Ethereum's history.
- •CryptoQuant data indicates ETH remains below its realized price, with only two of five historical bottom signals triggered so far.
- •Resistance is concentrated near $2,000, combining the psychological level, the 0.5 Fibonacci retracement, and the 100-day simple moving average around $1,971.
- •If the current Fibonacci support fails, the next downside targets are near $1,800 and the 50-day simple moving average at approximately $1,736.
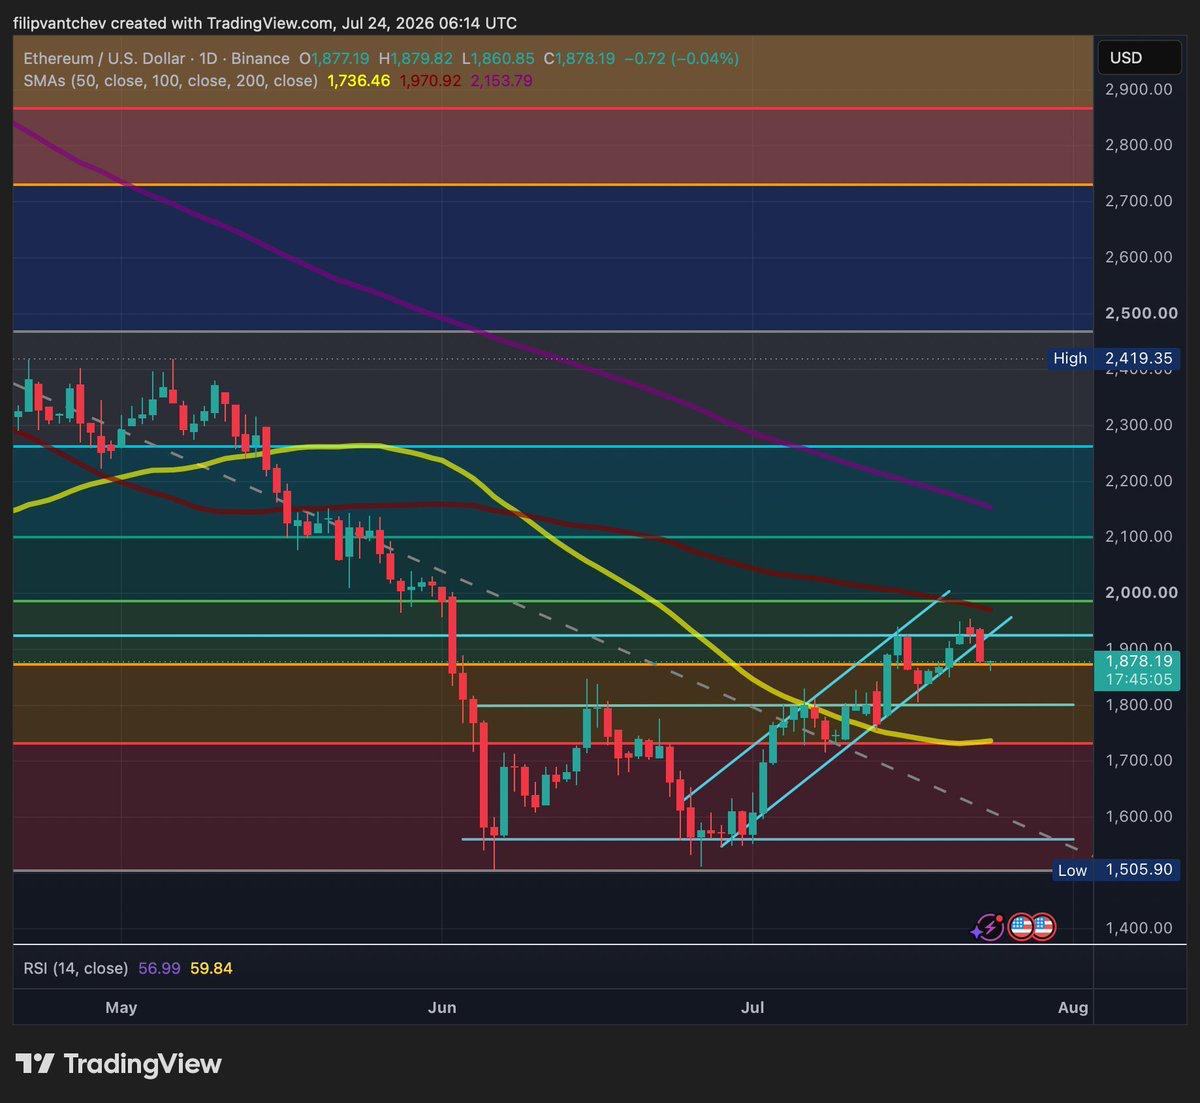
Ethereum was trading near $1,880 at the time of writing after slipping below the rising channel that had guided its rebound from the June low. The move has brought ETH back to the 0.382 Fibonacci retracement, turning the current zone into an immediate test of whether the recovery can remain intact.
The technical picture is divided. Ethereum is processing more transactions than at any previous point in its history, but onchain valuation data indicates that the market may not yet have completed a durable bottom. ETH also remains below its realized price, while only two of five historical bottom signals have triggered, according to the analysis cited in the source report.
When Ethereum was approaching $2,000, the token was moving into a concentrated area of resistance. That zone included the psychological $2,000 level, the 0.5 Fibonacci retracement and the declining 100-day simple moving average. The combination created several barriers in the same price region, making a near-term pullback the more likely outcome at that point.
Channel Break Puts Focus on Support
The rejection from that resistance area pushed ETH through the lower boundary of its rising channel. It also weakened the sequence of higher lows that had formed since late June, shifting attention from the recovery structure to the support levels beneath the market.
The 0.382 Fibonacci retracement is now serving as support near the current market price. If ETH successfully retests that level, the channel break would not fully invalidate the recovery, and Ethereum could regain a path toward the $2,000 area.
Even in that scenario, Ethereum would still face the same cluster of resistance. The 100-day simple moving average is near $1,971, while the 0.5 Fibonacci retracement is close to the psychological $2,000 level. ETH would need to recover that entire area before the rebound could develop into a more meaningful structural improvement.
Failed Retest Would Bring $1,800 Back Into View
If Ethereum fails to hold the current Fibonacci support, the next visible area is near $1,800. That level previously acted as resistance earlier in July before the price moved higher, giving it the potential to function as support during a pullback.
A loss of $1,800 would further weaken the recovery and increase the relevance of the 50-day simple moving average near $1,736. The daily relative strength index is close to 57, showing that momentum has improved from the deeply weak conditions seen around the June low. However, that momentum is not strong enough on its own to override a confirmed breakdown in price.
The chart therefore leaves Ethereum between two clear outcomes. Holding the current area would preserve a possible route back toward $2,000, while losing it would return attention to the lower support structure built during July.
Network Activity Moves in the Opposite Direction
Ethereum's price hesitation contrasts sharply with activity on the network. According to data from Joao Wedson, founder of Alphractal, Ethereum is now processing approximately 2.5 million transactions per day, close to the highest level recorded in the network's history.
That figure indicates that the blockchain is being used more heavily even as ETH remains far below its previous price highs. Rising transaction counts can reflect greater activity across stablecoins, decentralized finance, token transfers, applications and other onchain services. The record is particularly notable given that Ethereum's Layer 2 scaling networks — including rollups such as Arbitrum, Optimism and Base — have absorbed a growing share of transaction volume over the past two years, diverting activity away from the mainnet itself.
The record level is notable because it challenges the idea that weaker price performance necessarily reflects weaker adoption. Ethereum's market price and its network usage are currently presenting different pictures. Ethereum remains the largest smart contract platform by total value locked, and its continued usage across stablecoin settlement, DeFi protocols and tokenized assets anchors its position even as competing Layer 1 blockchains such as Solana have pursued higher throughput and lower fees.
Still, transaction growth should not be treated as an automatic price catalyst. A higher number of transfers does not show how much economic value is being settled, how much demand is reaching ETH itself or whether the activity is generating sustained fee revenue. The data supports the case for strong network usage, but it does not prove that the token is ready to break through resistance.
Realized Price Keeps the Bottom Question Open
CryptoQuant's realized-price data adds an important qualification to Ethereum's record transaction count. ETH is still trading below its realized price, which represents the average price at which the circulating supply last moved onchain. When the market price falls below that level, the average coin is effectively being valued below its most recent acquisition price.
Historically, that condition has appeared during periods of market stress and near major cycle lows. It can support a long-term value argument, but it does not identify the exact day or price at which a bottom will form. Since Ethereum's transition to proof-of-stake in September 2022, a portion of the ETH supply has been locked in staking contracts, reducing the freely circulating supply and adding a structural dimension to supply-demand dynamics that did not exist under proof-of-work.
According to the CryptoQuant analysis, only two of five historical Ethereum bottom signals have triggered so far. That suggests some conditions associated with previous lows are present, while others are still absent.
The distinction is important because trading below realized price can continue for an extended period. ETH may be undervalued relative to the aggregate holder cost basis without being ready for an immediate reversal.
Price Confirmation Remains Necessary
The three datasets describe different parts of the same market. The transaction record shows that Ethereum's underlying network remains active and widely used. The realized-price bands suggest that ETH is trading in a historically stressed valuation area. The daily chart shows that the market has not yet converted either signal into a confirmed recovery.
A successful defense of the 0.382 Fibonacci level would give Ethereum another opportunity to challenge the resistance concentrated around $2,000. A failure would indicate that record network activity is not yet translating into enough market demand to protect the current structure.
Ethereum's underlying activity may be improving, but the next technical test still depends on whether ETH can hold support and reclaim the levels that continue to block the recovery.
The information in this article is for educational purposes only and does not constitute financial, investment or trading advice.

