Ethereum by the Numbers 2026: Key Statistics Every Investor Should Know
Key Takeaways
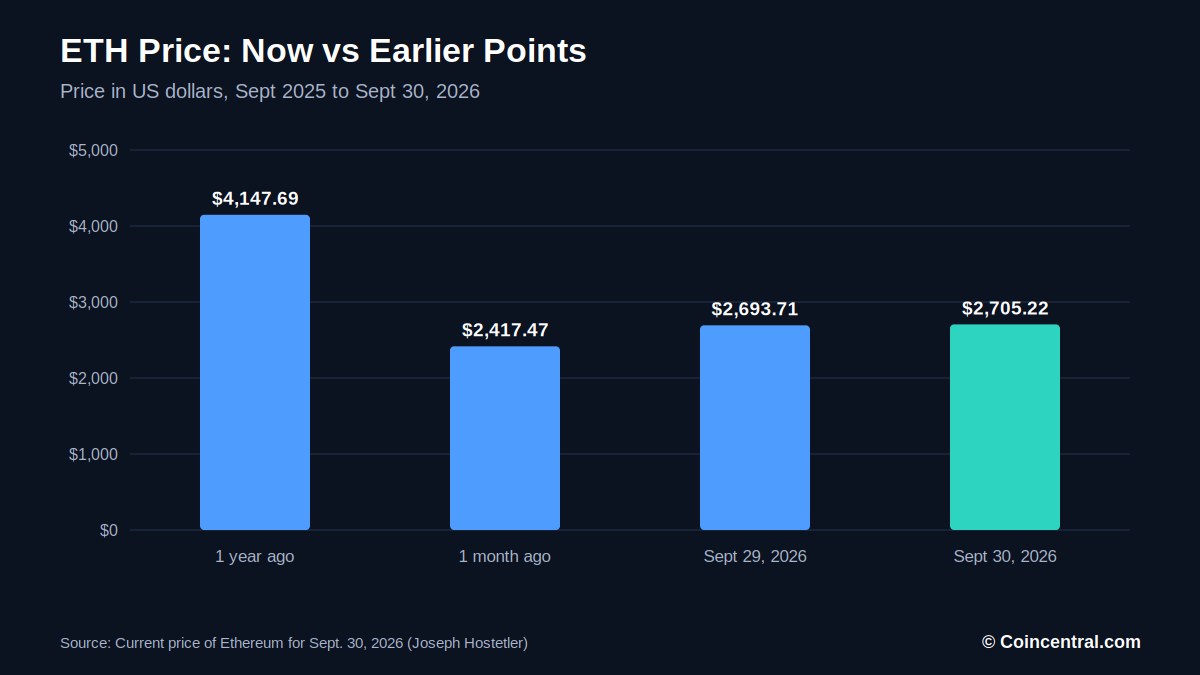
- •ETH traded at $2,705.22 on September 30, 2026, about 49.6% below its all-time high near $4,946 and 34.78% lower than a year earlier.
- •Ethereum's gross revenue dropped 69.3%, from $414 million in the first half of 2025 to $127 million in the first half of 2026, as trading and DeFi activity weakened.
- •Despite the revenue decline, network usage grew, with monthly active addresses up 15% to 8.4 million and smart contract deployments rising 74% to more than 1.3 million.
- •Ethereum leads key onchain segments, holding about $156 billion in stablecoins—roughly half of global supply—and 54% of the $70 billion in total value locked.
- •The Ethereum index posted a 23.14% compound annual growth rate from August 2017 to August 2026, but with a 94.65% standard deviation and a drawdown ongoing since November 2021.
Ethereum ranks as the second-largest cryptocurrency by market value. It is a network on which developers build applications, and ETH is the token used to pay for activity on that network.
This article compiles the main Ethereum statistics from several recent sources, covering price, returns, risk, market share, network usage, supply, upgrades and forecasts. Because prices moved from day to day, each figure is tied to its source and date. One theme runs through the figures: usage measures rose through 2026 even as price and fee revenue declined. Nothing here constitutes financial advice.
Ethereum Price Today: The Latest Numbers
At 9:50 a.m. Eastern Time on September 30, 2026, one ETH traded at $2,705.22. That price was $11.51 higher than the day before and roughly $1,442.47 lower than a year earlier. ETH gained 11.90% over the past month but lost 34.78% over the past year. The September 30 report includes a table listing each price point and its change relative to the current price. (Source: Current price of Ethereum for Sept. 30, 2026.)
Other sources show different prices because their snapshots were taken at different times. CoinStats listed $2,494.27 on October 1, 2026, a 24-hour gain of 2.48% and a 7-day drop of 7.56%. At that level, ETH sat 49.6% below its all-time high of $4,946.05. A forecasting site listed $2,496.15 on October 9, 2026, a 7-day decline of 9.42%. The gaps illustrate why a timestamp matters when reading any cryptocurrency price.
Several factors move the ETH price. The September 30 report cites investor sentiment, network activity, economic conditions, new regulation and competition from platforms such as Solana and Avalanche. In the short term, hype or panic often drives prices more than any other factor.
Ethereum Price History by Year
Ethereum launched on July 30, 2015. The 2014 crowdsale sold ETH at about $0.311 and raised $18.3 million in Bitcoin. ETH listed on Kraken on August 7, 2015 at $2.77 and fell to a low of $0.42 that October. The token ended 2015 at $0.93. By the end of 2017 it had reached roughly $757, a gain of about 9,000% for the year during the boom in token sales. The following year reversed course: ETH fell about 85% from its peak and closed 2018 near $130. (Source: Ethereum price history section, Ethereum (ETH) Price Prediction. Prices are approximate.)
The second all-time high arrived in August 2025, with sources placing it between about $4,897 and $4,946. ETH then declined through the end of 2025 and into 2026. One source points to recession fears and sales of ETH by co-founder Vitalik Buterin as factors in the early 2026 drop. 21shares lists a price of $1,570 on June 30, 2026, showing how far prices fell before the recent rebound.
According to one source, ETH's strongest gains have usually come in the 12 to 18 months following Bitcoin halving.
Ethereum Investment Returns
The Ethereum index in euros posted a compound annual growth rate of 23.14% from August 2017 to August 2026 — the yearly rate that would produce the same total gain if growth had been steady. Real years were anything but steady. The index was positive in only 4 of the 8 full years between 2018 and 2025. The best years were 2021 at 436.3%, 2020 at 423.5% and 2023 at 85.9%. (Source: Historical performance of the Ethereum index, euro terms.)
Recent returns are negative. The index returned -43.5% over the last year and is down 15.90% so far in 2026. Over five years it lost 27.0% in total, or about 6.1% per year. Another source notes ETH is up more than 60,000% from its 2014 sale price and about 46% from 2020 to 2025. As these figures show, the start date changes the result considerably.
Volatility, Drawdowns and Risk
Standard deviation measures how widely returns swing around the average. The Ethereum index recorded a standard deviation of 94.65%, indicating very wide swings. Its Sharpe ratio stood at 0.64; this ratio compares return with risk, and a higher number means more return per unit of risk.
A drawdown is a period during which value sits below a previous peak. The deepest drawdown ran from January 2018 to January 2021, lasted 3 years and reached a low of -89.6%. The longest drawdown began in November 2021 and has lasted 4 years and 9 months, with a low of -75.0% so far.
Monthly results were mixed: the index rose in 56 of 108 months (52%) between 2017 and 2026.
The source also describes value at risk, which estimates the most an investor could lose in a year with 95% confidence. It cautions that the method assumes normally distributed returns, which markets often do not follow, and that it says nothing about losses beyond the 95% level.
Ethereum Market Cap and Dominance
ETH ranks second among cryptocurrencies. A September 30 report put its market cap near $233 billion, behind Bitcoin at about $1.33 trillion and ahead of Tether at $183 billion. CoinStats listed $304.6 billion to $327.7 billion in early October. With 122,092,941 ETH in circulation, a price of $2,705.22 would imply roughly $330 billion. The $233 billion figure may date from an earlier point, so readers should consult a live tracker for the current market cap. (Source: Current price of Ethereum for Sept. 30, 2026.)
Market dominance measures a coin's share of total cryptocurrency market value. Bitcoin's share of the market rose from about 39% to as high as 65% over three years, while ETH's share fell from about 18% to near 9% over the same period. More recently, ETH recovered to 14% and Bitcoin eased to about 57%. Analyst William Mougayar projects ETH could reach about 25% in 2026, with Bitcoin at 45% to 50% — a single view rather than a measured result.
Ethereum was built as a computing platform, not only as money. A common comparison calls Bitcoin digital gold and ETH digital oil, the fuel that keeps apps and smart contracts running.
Ethereum Network Revenue and Activity
Ethereum's gross revenue fell 69.3%, from $414 million in the first half of 2025 to $127 million in the first half of 2026, according to data from DeFiLlama, Blockworks and TokenTerminal as of June 30, 2026.
All four revenue streams declined: base fees, Layer 2 fees, priority fees and maximum extractable value (MEV). Weak trading and DeFi activity reduced demand for block space. A similar fall of 64% occurred between the first halves of 2022 and 2023, and later upgrades — EIP-4844 and EIP-7691 — also cut fees across the ecosystem, which lowers revenue. The decline also reaches supply mechanics: the base fee on every transaction is burned, so weaker activity removes less ETH from circulation, the mechanism described in the supply section below.
Network usage kept growing. Monthly active addresses rose 15% year over year to 8.4 million. Smart contracts deployed rose 74% to more than 1.3 million, though spam may account for part of that count. The writer of the report calls the revenue drop less alarming than it first appears, because it follows the pattern of the last bear market. (Source: Ethereum's H1 2026 earnings. Data as of June 30, 2026.)
Stablecoins, Tokenized Assets and Locked Value
Stablecoins on Ethereum grew 22% year over year to about $156 billion by June 2026, and roughly half of all global stablecoin supply sits on the network.
Ethereum also holds about $16 billion, or 47%, of the $34 billion in tokenized real-world assets onchain, which include stocks, bonds and commodities.
Total value locked (TVL) tracks funds deposited in blockchain applications. Ethereum holds about $37 billion of the $70 billion total — a 54% share — while making up 32% of the market cap outside bitcoin and stablecoins. The report links this gap to Ethereum's long track record and names rivals: Hyperliquid and Solana in trading, and Tron and Solana in stablecoins. (Source: Ethereum's H1 2026 earnings. Data as of June 30, 2026.)
CoinStats adds that BlackRock's BUIDL tokenized fund launched on Ethereum, and that Visa includes Ethereum in its stablecoin settlement program. Both examples put established financial firms on the network as users of its infrastructure, not merely holders of the token.
Ethereum Supply, Staking and Fees
There is no fixed maximum supply of ETH. CoinStats reports 122,092,941 ETH in circulation, with new coins issued as rewards to validators. Since EIP-1559 took effect in August 2021, the base fee on each transaction has been burned. When activity is high, more ETH can be burned than issued; when activity is low, supply grows.
21shares says ETH has become net inflationary as more activity moves to Layer 2 networks, with annual inflation of 0.86% compared with 1.7% for gold.
The Merge on September 15, 2022 moved Ethereum from mining to staking, cutting energy use by about 99.95%. A validator normally deposits 32 ETH. Pectra, implemented in May 2025, raised the maximum effective balance to 2,048 ETH. Validators work in 12-second slots, and a checkpoint becomes final when at least two-thirds of staked ETH supports it. Validators who break the rules can lose staked ETH through.
Staking lets holders lock ETH to help verify transactions and earn rewards, much like interest. CoinStats lists concentration among large staking providers and custodians as a trade-off. (Sources: CoinStats AI; Ethereum roadmap; Ethereum's H1 2026 earnings.)
Ethereum Upgrade Timeline and Roadmap
Ethereum changes through planned upgrades. Ideas begin as public discussions and then become Ethereum Improvement Proposals that anyone can comment on. Dencun in March 2024 added blob transactions, which lower the cost of data for Layer 2 networks. Pectra and Fusaka expanded that capacity. (Source: Ethereum roadmap. The scope of planned upgrades is not final.)
The two planned upgrades target faster syncing, parallel processing and stronger resistance to transaction censorship. CoinStats said Glamsterdam was in development for a possible Q4 2026 release — the nearest dated milestone for readers tracking the network's next phase.
Ethereum Price Forecast Statistics
Forecasts are estimates and often miss. The ranges below come from one forecasting site and several analysts, and they differ widely.
The forecasting site listed a 2026 range of $2,315.62 to $2,715.56, with an average of $2,537.09. Its technical indicators showed 41% bullish and 59% bearish sentiment, and its Fear & Greed score was 64. (Source: Ethereum (ETH) Price Prediction 2026 to 2050. The source gives two different 2027 ranges, so that year is omitted here.)
Analyst views for 2026 vary. Benzinga's data places ETH between $3,000 and $6,000 in bullish conditions, while InvestingHaven suggests $2,500 to $5,500. Citi cited $4,500 and Standard Chartered cited $7,500.
For 2030, Traders Union offers $5,161 to $5,727, Benzinga spans $1,696 to $6,319, Finder projects $10,000 or more, and Cryptopolitan projects $14,532 to $18,135.
One source says $15,000 is possible but not the base case; it would likely require sustained network growth, a dominant share of smart contracts and steady institutional inflows.
21shares uses a different method. It says 50% of the $723 billion value of the Apple and Google app stores would imply about $2,995 per ETH, 91% above the June 30, 2026 price of $1,570. The firm describes this as a framework for long-term potential rather than a price target.
Key Takeaways
The numbers point to a market with large swings and a growing network.
- Price is down 34.78% in a year, and the index has been in a drawdown since November 2021. Revenue fell 69.3% in the first half of 2026.
- ETH traded at $2,705.22 on Sept. 30, 2026, versus an all-time high near $4,946.
- The Ethereum index returned a 23.14% yearly rate over nine years, with a standard deviation of 94.65%.
- Ethereum holds 54% of total value locked and about half of stablecoin supply.
- Active addresses rose 15% and smart contract deployments rose 74% in the year to June 2026.
- Annual inflation is 0.86%, compared with 1.7% for gold.
- Forecasts range from under $2,000 to above $18,000 for 2030 and should be read as estimates.
Sources list four common ways to invest: a crypto exchange, an Ethereum ETF, Ethereum-related stocks and a crypto IRA, each with different costs and risks.
Ethereum faces competition from other blockchains, DeFi security exploits and changing rules. Past results do not predict future returns, and ETH can lose value quickly.
Sources
- Current price of Ethereum for Sept. 30, 2026 (Joseph Hostetler)
- Historical performance of the Ethereum index, August 2017 to August 2026
- Ethereum (ETH) Price Prediction 2026, 2027, 2028 to 2040 (Steve Taylor)
- Ethereum's H1 2026 earnings: a bear market dip in a growing network (Matt Mena, 21shares)
- What Is Ethereum (ETH)? Fundamentals Explained (October 2026) (CoinStats AI)
- Ethereum roadmap
- What will ETH's % dominance be in 2026 vs. BTC vs. ALTs? (William Mougayar)
This article is based on reporting originally published by CoinCentral.

