Ethereum's Stablecoin Liquidity Pulls Back on Binance as Fees Rebuild
Key Takeaways
- •Ethereum's stablecoin netflow on Binance fell 518% week-over-week and 728% against its quarterly baseline, representing one of the widest structural moves currently tracked across 148 market metrics.
- •The Coinbase premium index declined to negative 0.12, suggesting softer U.S. spot demand relative to the broader global market.
- •Ethereum's staking rate increased from 33.44% to 33.90%, progressively reducing the liquid circulating supply available for trading since the Shanghai upgrade enabled withdrawals.
- •Weekly burnt transaction fees rose approximately 48%, yet remain about 54% below their 90-day average, indicating network activity has not fully recovered to prior levels.
- •A daily close above $2,150 is required to confirm a bullish structure shift, while failure to reclaim that level could push Ethereum toward $1,700 or lower.
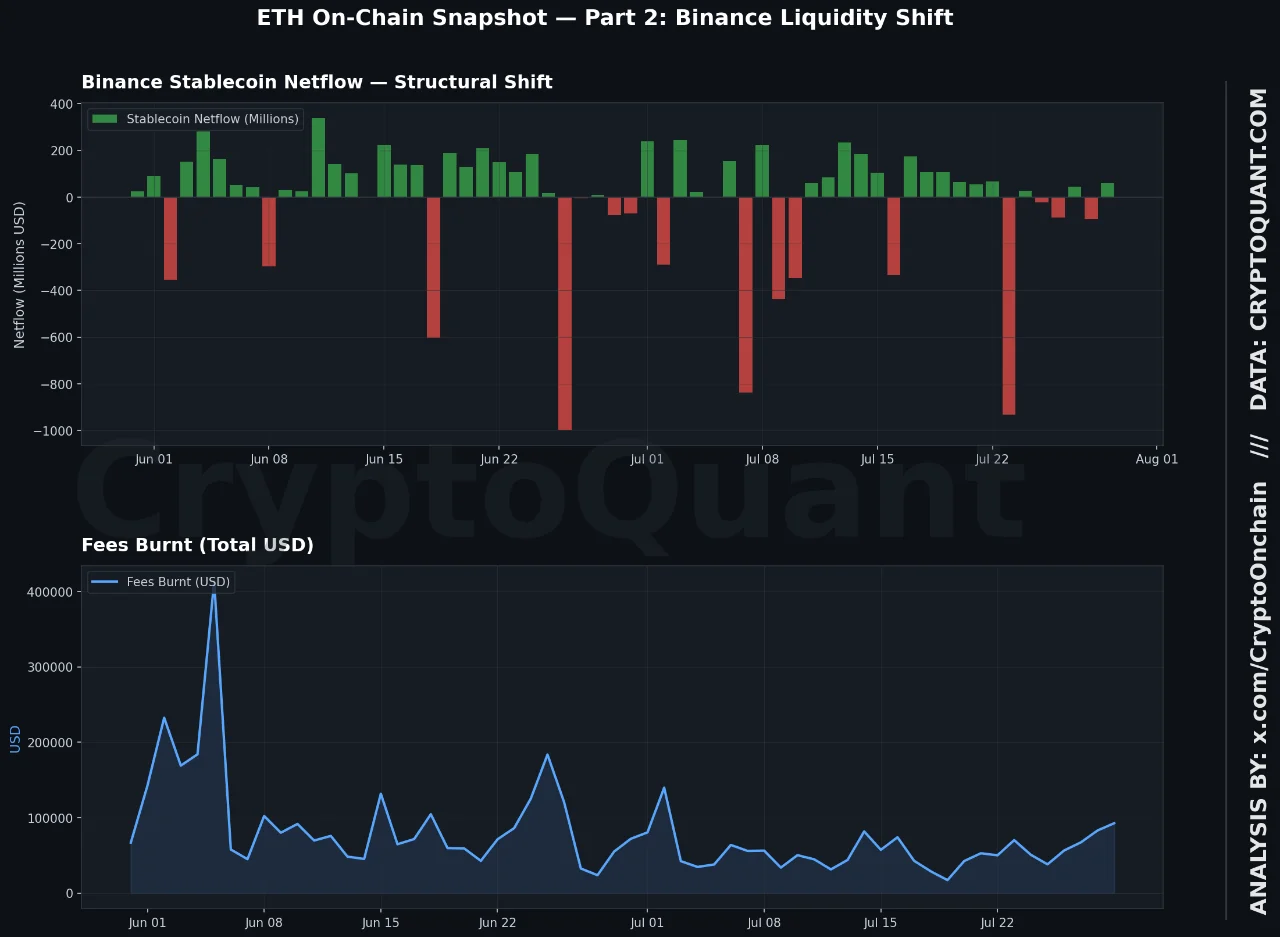
Ethereum's stablecoin netflow on Binance has recorded one of the largest structural shifts among 148 tracked metrics, falling sharply across weekly, monthly, and quarterly baselines. Stablecoin netflow reflects the difference between stablecoins moving into and out of an exchange; sustained outflows typically signal reduced capital positioned for immediate crypto purchases or migration toward self-custody and DeFi protocols. This reversal, combined with a weaker Coinbase premium, points to a transitional phase for Ethereum's market structure.
Over the past two weeks, Ethereum traded between $1,840 and $1,953 and currently sits near $1,908. The network's staking rate climbed steadily from 33.44% to 33.90%, indicating gradual asset lock-up. Since the Shanghai upgrade enabled withdrawals in April 2023, staked ETH has continued to grow, progressively reducing the liquid circulating supply available for trading.
Binance Stablecoin Netflow Marks a Sharp Reversal
Ethereum's stablecoin netflow on Binance fell 518% week-over-week, marking a sharp reversal. Compared with its monthly baseline, the metric dropped 347%. Against the quarterly baseline, the decline reached 728%, one of the widest structural moves currently tracked.
Binance remains the deepest venue for Ethereum stablecoin settlement, making its order book closely watched by analysts. Because large flow shifts tend to appear there first, this reversal offers an early signal. Analysts monitoring liquidity often treat Binance data as a leading indicator for broader market repositioning.
The scale of this shift stands out among 148 metrics tracked across the market. Such structural moves rarely occur in isolation and often coincide with other exchange trends. Traders watching Ethereum's stablecoin flows may view this development as an early warning sign.
Exchange Flows and Coinbase Premium Signal Caution
Aggregate exchange netflow for Ethereum stayed negative on most recent days. The Coinbase premium index also slipped further, reaching negative 0.12. This combination may point to softer U.S. spot demand relative to the broader market, a pattern that often precedes short-term price consolidation for major assets.
Weekly transaction fees burnt on the Ethereum network rose roughly 48%. Despite that increase, fees remain about 54% below their 90-day average, suggesting network activity has not fully recovered to prior levels. Since EIP-1559 went live in August 2021, a portion of every transaction base fee is permanently destroyed, making burnt fees a commonly used proxy for real-time on-chain demand.
Large-holder exchange activity, tracked through top-ten inflow and outflow data, is trending lower across weekly, monthly, and quarterly windows alike. Reduced large-holder participation on exchanges often reflects lower short-term trading interest and may indicate reduced appetite for near-term repositioning among whales.
Technical Structure Points to Key Resistance Levels
Ethereum recently filled a fair value gap between $1,954 and $1,892, according to Crypto Patel. Price continues recovering from June lows, though the higher timeframe structure remains bearish. The current rally is testing a previously respected bearish order block.
Crypto Patel's analysis, shared on X, frames the current rally as corrective:
Ethereum Just Filled A Key FVG: Is A Massive Rejection Coming? $ETH continues to recover from the June lows, but the HTF structure remains bearish until key resistance is reclaimed. Price has fully rebalanced the nearby FVG $1,954–$1,892. The current rally is testing a… pic.twitter.com/SQEcXsmmQY
— Crypto Patel (@CryptoPatel) July 28, 2026
A daily close above $2,150 would be needed to confirm a bullish structure shift. Failure to reclaim that level could send Ethereum back toward $1,700. The $1,500 level remains the major downside liquidity target if selling resumes.
The $2,046 to $1,975 range stands as the primary bearish order block on the daily chart. As long as Ethereum trades below $2,150, the recovery looks corrective rather than a confirmed reversal. Traders are watching this zone closely for the next directional move, as a break below current support could reopen prior liquidity zones downward.

