Ethereum Rejected Twice at $1,915–$1,950 Resistance as $1,870 Support Comes Back into Focus
Key Takeaways
- •Ethereum was turned back twice at the $1,915–$1,950 resistance zone on July 30 and July 31, with the July 31 intraday high of $1,935 falling short of the 100-day SMA at $1,940.
- •The 0.382 Fibonacci retracement near $1,870 has held as support for five consecutive trading sessions, keeping ETH confined within an approximately $80 range.
- •The Federal Reserve maintained its target range at 3.5%–3.75% and the Bank of Japan held its policy rate at 1.0%, with dissenting votes at both meetings keeping further tightening under consideration.
- •Ethereum ETFs recorded a combined $5.36 million net outflow across July 29–30, and CoinGlass data showed negative net flows in both spot and futures markets during the latest reporting periods.
- •Momentum has not deteriorated despite the rejections, as the RSI stands at 58 and remains above its signal line at 52.
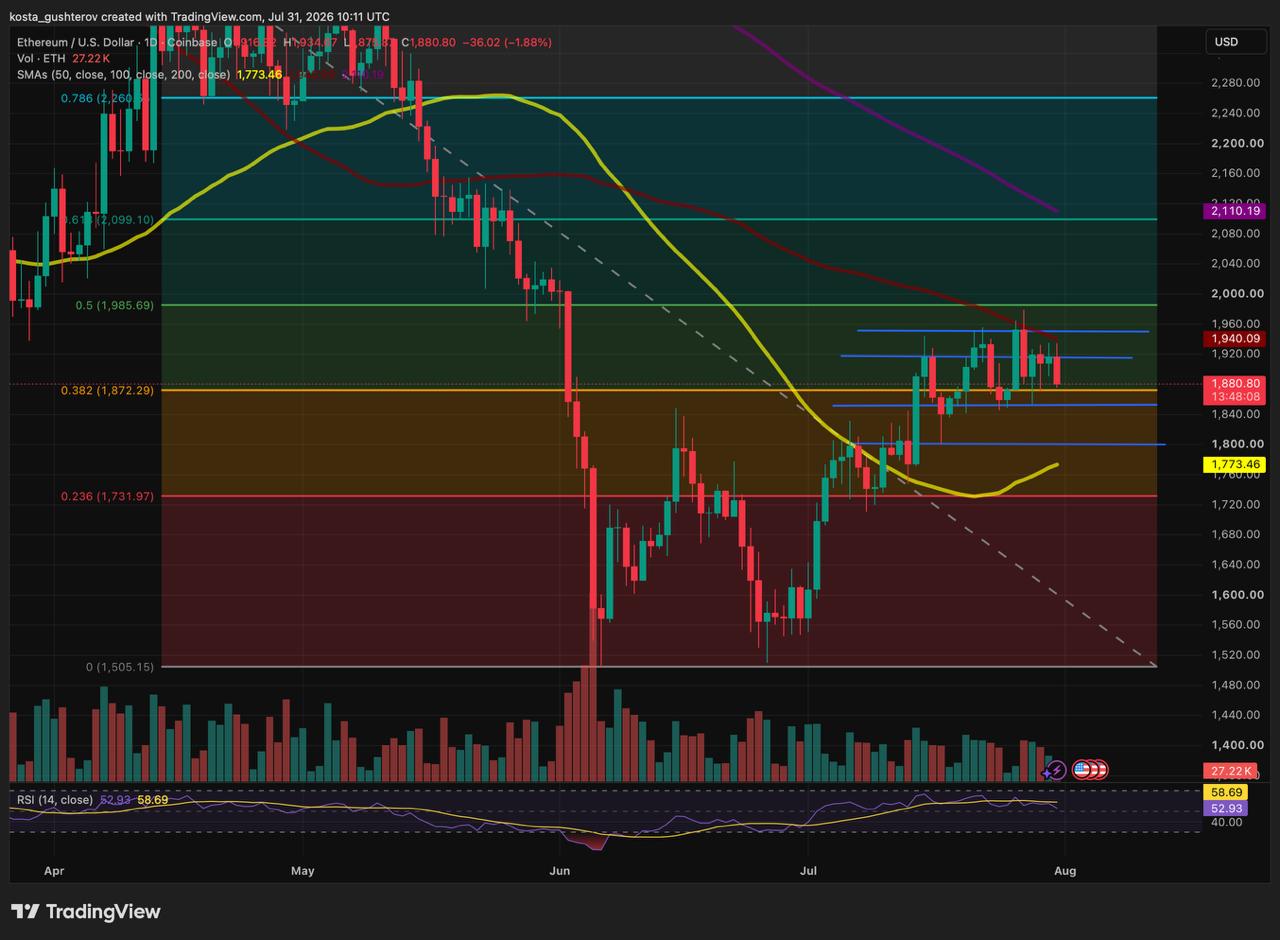
Ethereum faced rejection within the $1,915–$1,950 resistance zone on both July 30 and July 31, confirming the area as the primary obstacle for the ongoing rebound. ETH reached an intraday high of $1,935 on July 31 before reversing just below the 100-day simple moving average (SMA) at $1,940. The pullback has since brought price back to the 0.382 Fibonacci retracement near $1,870, a level that has held for five consecutive sessions.
A prior analysis flagged the $1,915–$1,950 band as the rebound's main hurdle. ETH has now been turned back twice at that zone — first on July 30 and again on July 31 — redirecting attention to the $1,870 Fibonacci support. The roughly $80 corridor between $1,870 and $1,950 has contained ETH for the better part of the week, compressing intraday volatility into a narrowing band.
ETH Stalled Just Below the 100-Day SMA
The July 31 peak approached the 100-day moving average but did not reach it. Selling pressure emerged inside the broader resistance area defined by the $1,920 horizontal level, the declining 100-day SMA, and the upper boundary near $1,950.
The two consecutive rejections indicate that buyers have not yet absorbed the supply concentrated in this region. A brief move above $1,920 would carry limited significance unless ETH also clears the 100-day SMA and sustains a position above it.
Despite the reversal, momentum has not deteriorated. The Relative Strength Index (RSI) stands at 58, remaining above its signal line at 52.
ETH Returns to the $1,870 Support
The 0.382 Fibonacci retracement near $1,870 has halted every pullback over the past five trading sessions. On July 31, Ethereum dropped to $1,875, placing price within approximately $5 of that retracement level.
A daily close below $1,870 would breach the support that has persisted throughout the week. The next visible reaction zones are located near $1,850 and $1,800 — levels where buyers previously stepped in after ETH traded below the same Fibonacci level.
Central Bank Meetings Add No New Rate Shock
Neither of the week's major central-bank decisions resulted in a rate increase.
The Federal Reserve maintained its target range at 3.5%–3.75% on July 29, though three voting members favored a 25-basis-point hike. The Bank of Japan held its short-term policy rate at 1.0% on July 31, with one member supporting an increase to 1.25%.
The meetings did not introduce a new rate shock to ETH's pullback, although the dissenting votes kept the prospect of further policy tightening on the table.
ETF and Market Flows Remained Soft
The latest Ethereum ETF data from SoSoValue shows:
- July 30: $13.29M net inflow
- July 29: $18.65M net outflow
- Combined result: $5.36M net outflow
The July 30 inflow recovered most of the prior day's outflow, leaving the two-day total slightly negative. The dataset does not yet include July 31, meaning the ETF response to the second rejection cannot be assessed. When that July 31 figure becomes available, it will offer the first read on whether institutional demand shifted in response to ETH being turned back at the 100-day SMA for a second consecutive session.
CoinGlass spot and futures data also showed negative net flows during the latest reporting periods at the time of publication:
- Spot, 24 hours: $394.12M in, $436.05M out, net −$41.93M
- Spot, 3 days: $1.21B in, $1.26B out, net −$49.08M
- Futures, 24 hours: $7.80B in, $8.07B out, net −$267.24M
- Futures, 12 hours: $4.31B in, $4.68B out, net −$363.60M
The 12-hour futures outflow was $96.36 million larger than the full 24-hour figure, implying that the earlier half of the window was net positive by roughly the same amount.
In spot markets, the latest 24 hours accounted for approximately 85% of the three-day net outflow, indicating that most of the weakness was concentrated in the most recent period.
Ethereum currently sits between support near $1,870 and resistance from $1,915 to $1,950. A daily close below support would expose $1,850 and $1,800, while a close above the 100-day SMA and $1,950 would place the 0.5 Fibonacci retracement near $1,985 into view.
Disclaimer: This article is for informational purposes only and does not constitute financial or investment advice. Technical levels can fail, and flow data describes completed activity rather than future price direction.
Methodology: Price levels, moving averages, Fibonacci retracements, and RSI readings are derived from the ETH/USD daily chart on Coinbase dated July 31, 2026. The $1,880 price and 1.8% decline are intraday readings. ETF figures come from SoSoValue and cover July 29 and July 30. Spot and futures flow figures come from CoinGlass dashboards captured on July 31. The estimated $96 million earlier futures inflow and the 85% spot-flow concentration were calculated from the net figures.

