Ethereum Price Prediction: ETH Eyes $2,855 as Atomic L1-L2 Test Lands
Key Takeaways
- •Ethereum recovered above the $2,600 resistance and traded near $2,714 on Oct. 6, with a confirmed break above $2,855 opening the path toward $3,163.
- •On-chain accumulation continued for more than a week, but exchange deposits, including a 33,209 ETH net inflow on Oct. 2, created supply-side pressure.
- •The Coinbase Premium Gap declined 46% over 30 days, indicating weaker U.S. spot demand.
- •The Ethereum Economic Zone completed an atomic Layer 1-to-Layer 2 transaction test using shared sequencing bundled execution, though production-scale deployment and security reviews remain pending.
- •Fundstrat co-founder Tom Lee projected Ethereum could reach $25,000-$50,000 in the current cycle, a target far above prevailing prices.
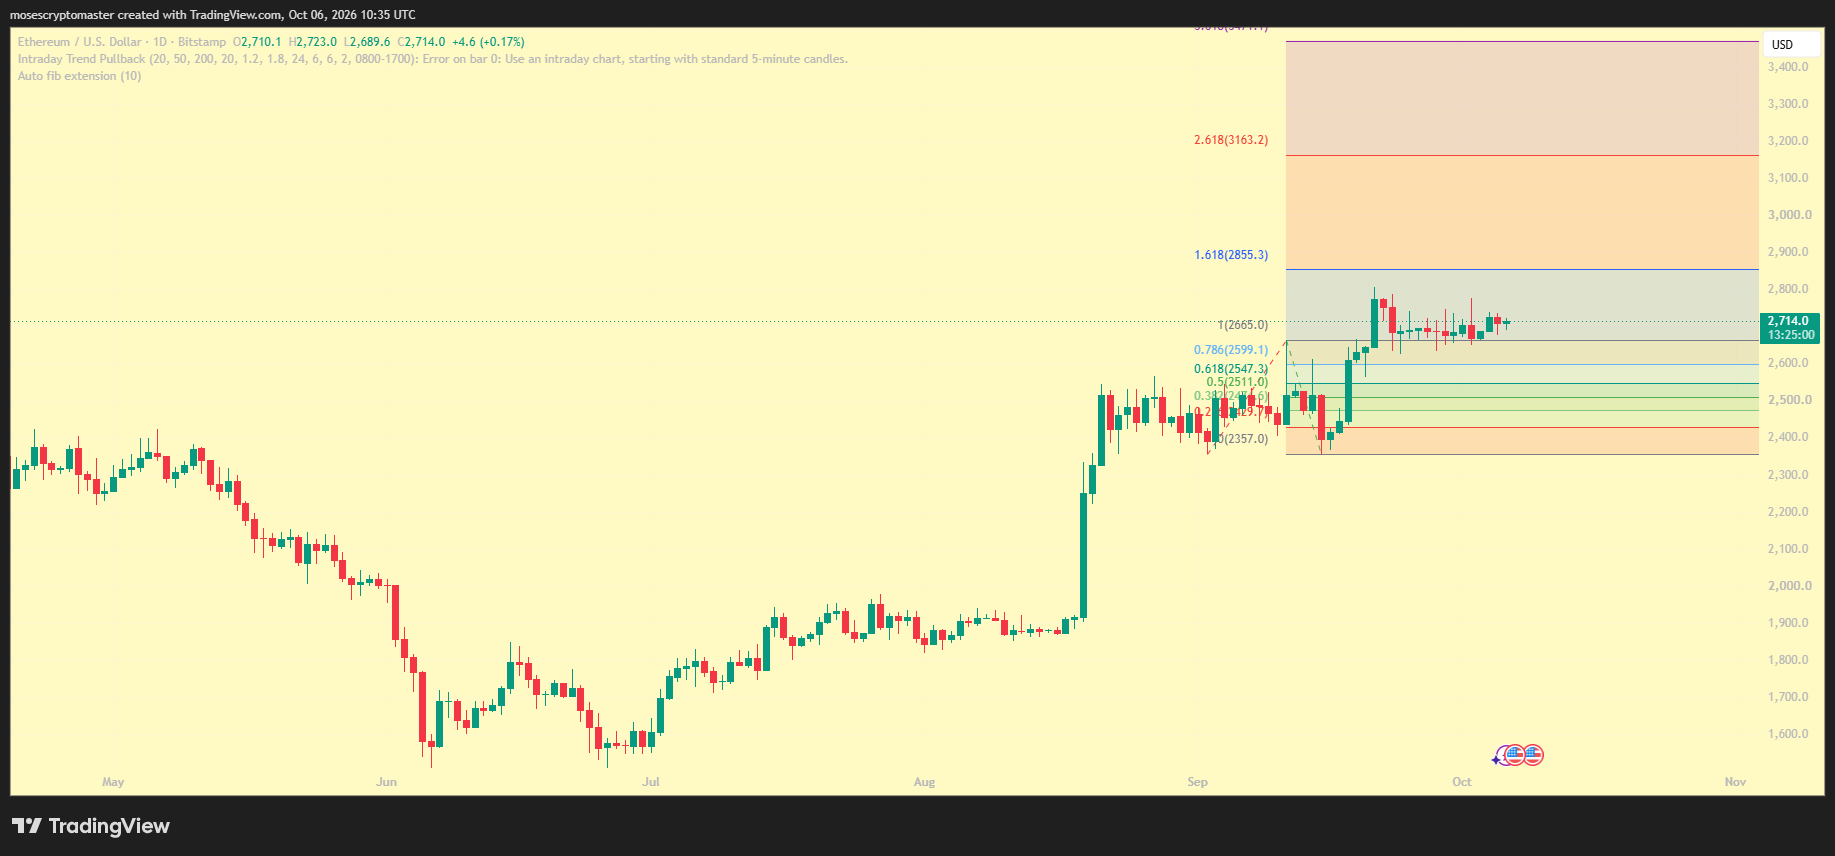
Ethereum (ETH) traded near $2,714 on Oct. 6 after recovering above the $2,600 resistance level. TradingView data showed the asset consolidating below its next technical extension near $2,855, leaving the price outlook dependent on whether buyers can defend the recent gains.
The recovery coincided with on-chain accumulation signals and a new Ethereum scaling test. Rising exchange deposits, however, created a counterweight to the improving technical structure.
ETH Approaches $2,855 Resistance
TradingView data showed Ethereum changing hands around $2,713.80 during the Oct. 6 session, with the daily chart placing the immediate resistance zone around $2,855.
ETH previously pushed through the $2,599 Fibonacci level before consolidating above it. The chart identified lower retracement support around $2,547 and $2,511. That structure kept the technical picture constructive while ETH remained above $2,600. A confirmed break above $2,855 would expose the next extension near $3,163.
The broader chart also showed Ethereum recovering sharply from its September lows near $2,357, although buyers had not confirmed another breakout as of the most recent daily candle.
Analyst Wealthmanager said ETH was approaching major weekly resistance following its recovery. The analyst also noted that the 50-period exponential moving averages had started providing support.
Accumulation Meets Exchange Selling Pressure
Analyst CW reported recurring ETH accumulation within Ethereum's current price range, saying the pattern had continued for more than one week despite sideways price movement. That trend supported the bullish case, but exchange flow data showed conflicting signals.
CryptoOnchain reported a seven-day average exchange netflow of positive 6,950 ETH on Oct. 4. The provider also recorded a net exchange deposit of 33,209 ETH on Oct. 2, and its data showed 30-day exchange netflows rising 180% during the period.
Ethereum network fees reached $1.49 million on Sept. 28, according to CryptoOnchain, measured a 4.94 Z-score during the activity increase, a statistical reading of how far activity sat above its historical average. Meanwhile, the provider's Coinbase Premium Gap measure, which tracks the spread between Coinbase pricing and other major trading venues, declined 46% over 30 days, a reading that pointed toward weaker U.S. spot demand over the period.
The opposing signals leave ETH positioned between accumulation and exchange-side supply. Sustained deposits could restrict upside before buyers test the next resistance zone.
Atomic L1-L2 Test Adds Scaling Catalyst
Ethereum's network development added another factor beyond price action and exchange flows. Ethereum Economic contributor Eduardo Antuña Díez reported an atomic Layer 1-to-Layer 2 transaction test that linked a 0.001 ETH Layer 1 action with a rollup state update, with both actions designed to execute together or revert together.
Ethereum Economic Zone documentation describes this model as synchronous cross-layer execution. It targets reduced dependence on separate bridge workflows between Ethereum and rollups. Rollups process transactions off Ethereum's base layer and post results back to it, which is why state changes spanning both layers have typically required separate bridge steps. The project uses shared sequencing and bundled execution to coordinate Layer 1 and Layer 2 actions.
A single successful transaction, however, does not demonstrate production-scale performance. That distinction matters for the outlook: while the test provided a technical milestone, deployment, security reviews and broader adoption remain separate hurdles.
Gnosis and Zisk launched the Ethereum Economic Zone initiative in March 2026. The project has received Ethereum Foundation funding for its interoperability work.
Tom Lee Target Extends Longer-Term Horizon
A video posted by DeFi commentator Davey showed Fundstrat co-founder Tom Lee discussing Ethereum at Ondo's Open Interest Summit. Lee said ETH could reach between $25,000 and $50,000 during the current cycle. That target remained far above prevailing prices and represented an analyst projection rather than an established market valuation.
The immediate outlook therefore remains tied to nearer technical levels. TradingView placed $2,855 as the next important upside level after the recovery above $2,600. A rejection could return attention toward the $2,599 and $2,547 support zones, and continued exchange deposits would add pressure if spot demand weakened further. Conversely, a daily breakout above $2,855 would shift attention toward $3,163.
The coming sessions will show whether accumulation can absorb exchange-side supply, with exchange netflow data and the Coinbase Premium Gap serving as ongoing reference points for deposit pressure and U.S. spot demand.

