Ethereum Rises 5% as Short Squeeze and $141M Single-Day ETF Inflows Align
Key Takeaways
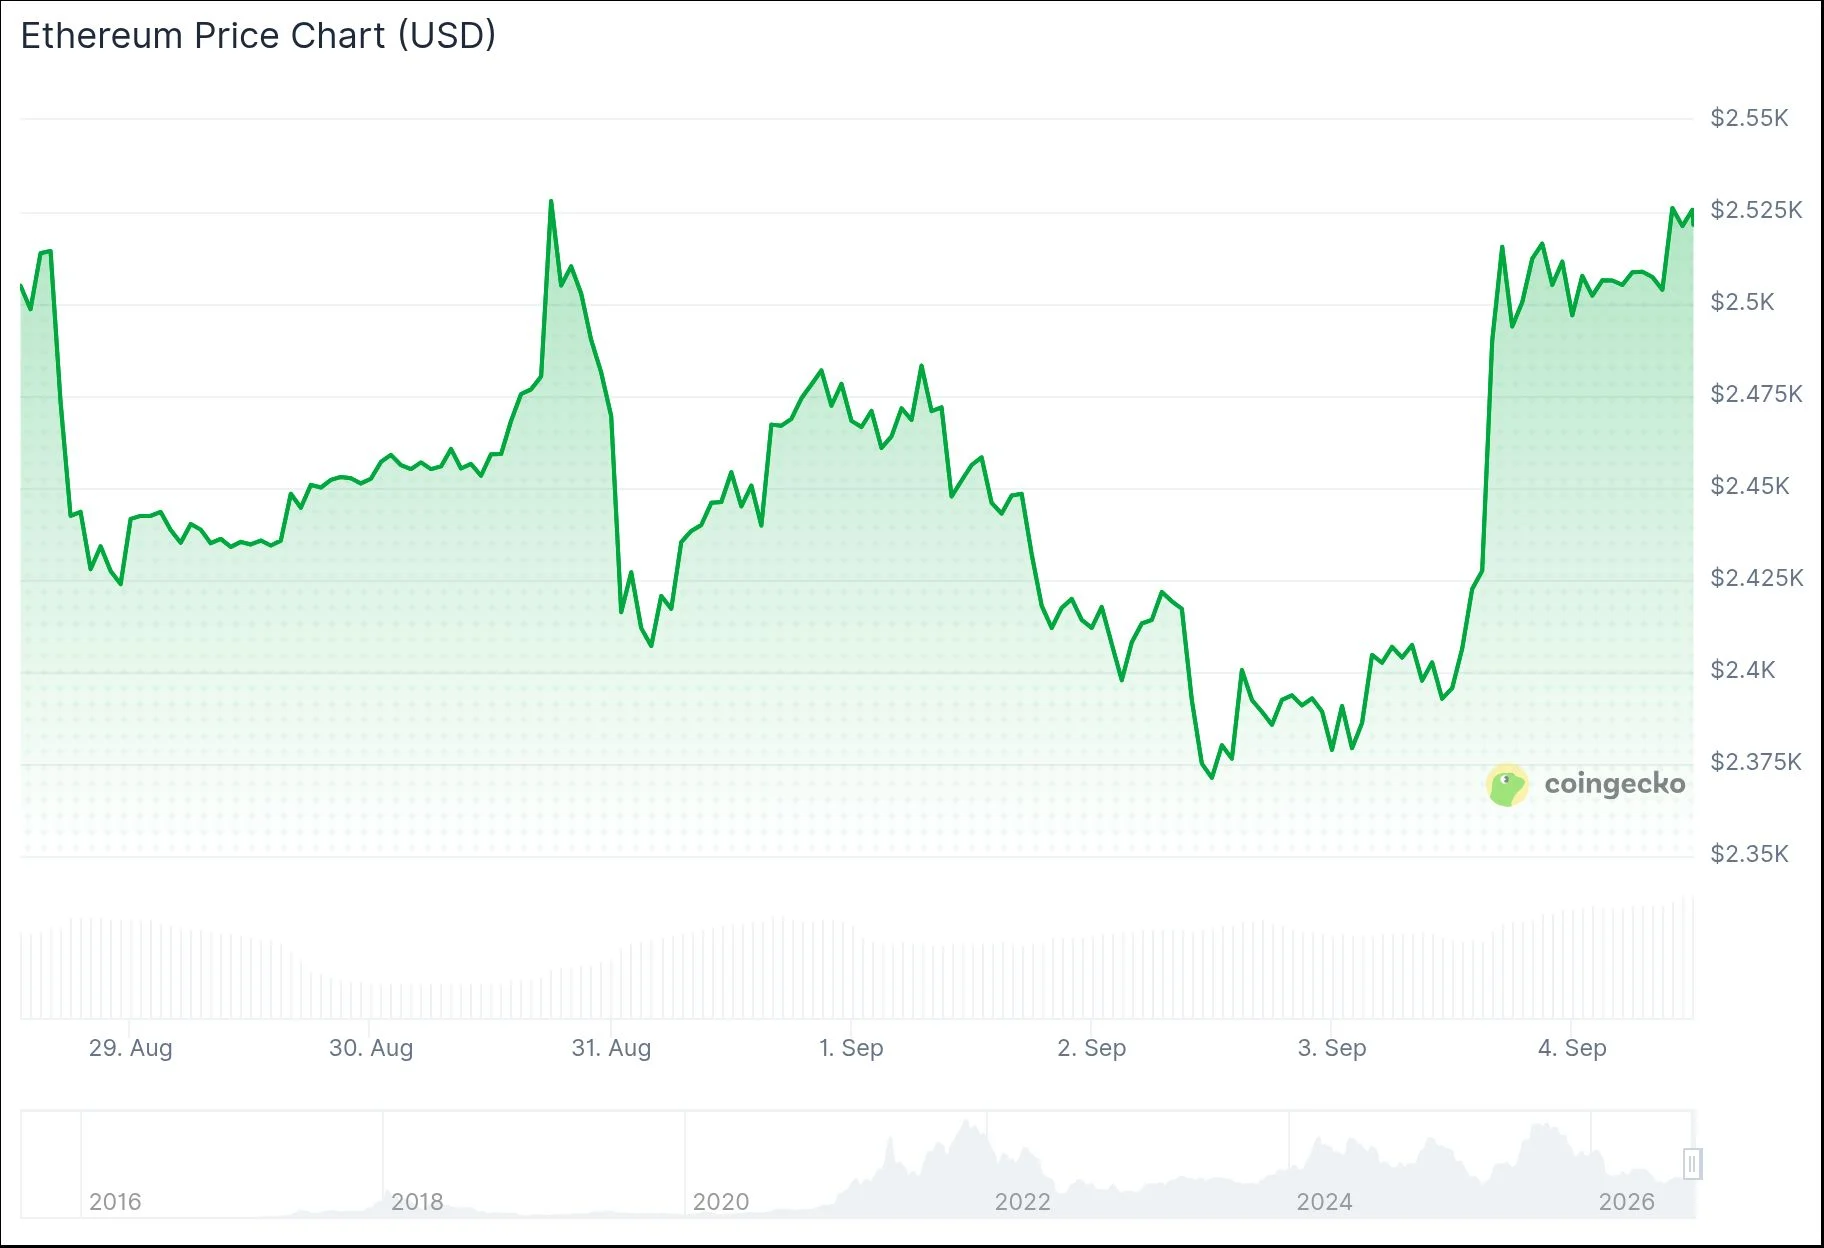
- •Ethereum climbed roughly 5% on September 4 to about $2,508, testing the $2,560 resistance after weeks of range-bound trading.
- •US spot ETH ETFs recorded $141.39 million in net inflows on September 3, with BlackRock's ETHA contributing $72.07 million and Fidelity's FETH $65.11 million.
- •The rally was fueled by macro factors including easing US-Iran tensions and a drop in September rate-hike odds from 70% to 50% after weak ADP jobs data.
- •Short liquidations reached $82.41 million over 24 hours, far exceeding $20.76 million in long liquidations.
- •ETH trades above all four key EMAs, with the range top near $2,560 having rejected every push since August 27.
Key Points
- ETH climbed roughly 5% on Thursday, trading near $2,508 and testing the $2,560 resistance zone.
- US spot ETH ETFs pulled in $141.39 million in net inflows on September 3, reversing the prior day's $48 million outflow.
- Short liquidations reached $82.41 million over 24 hours, far outpacing $20.76 million in long liquidations.
- The rally was driven by macro factors — easing US-Iran tensions and falling Fed rate hike odds.
- ETH holds above all four key EMAs, with the next major resistance at $2,560, then $2,600.
Macro Catalysts Lift ETH Out of Its Range
Ethereum climbed roughly 5% on Thursday, September 4, pushing the price to around $2,508. The move came after weeks of range-bound trading between $2,400 and $2,560.
The rally was not driven by anything ETH-specific. Two macro events moved the needle. First, reports suggested the US-Iran conflict may be winding down, reducing risk-off pressure across markets. Second, Fed Governor Christopher Waller pushed back on a September rate hike, saying, "Give disinflation a chance. We can wait one meeting."
Weak jobs data added to the case. ADP reported that US private employers added just 38,000 jobs in August, well below the 47,000 expected and the weakest reading since January. Odds of a September rate hike dropped from 70% to 50%. That matters for crypto specifically: as a risk asset class with no cash flows, ETH has historically traded sensitively to expectations about the direction of interest rates, with looser policy expectations tending to support speculative demand.
Analyst Ted Pillows (@TedPillows) noted on X that ETH tapped the $2,550 resistance and was rejected, and that a weekly close above $2,550 could open the door to a rally toward $3,000:
$ETH tapped the $2,550 resistance again and got rejected. If Ethereum manages a weekly close above the $2,550 level, it could quickly rally to $3,000. pic.twitter.com/JxJU5AJnBu — Ted (@TedPillows) September 4, 2026 (X post)
ETF Flows Reverse Sharply
After recording $48.08 million in outflows on September 2, ETH spot ETFs rebounded strongly. Net inflows on September 3 reached $141.39 million. BlackRock's ETHA led with $72.07 million, followed by Fidelity's FETH at $65.11 million. Grayscale's ETHE remained a drag at negative $6.07 million. Cumulative inflows across all ETH funds now stand at $13.17 billion.
Since their US launch in 2024, spot ETH ETFs have become a key channel for institutional and retail exposure to Ethereum without holding the token directly, which is why daily flow prints are now watched as a proxy for traditional-finance demand alongside on-chain metrics.
The fund flows and spot price moved in the same direction on both days — the dip and the rebound tracked almost exactly.
Shorts Take the Hit
ETH derivatives volume rose 17.84% to $57.18 billion in 24 hours. Open interest climbed 5.36% to $34.13 billion. Short liquidations hit $82.41 million against $20.76 million for longs — a clear squeeze. Liquidations of this kind can mechanically amplify price moves: when leveraged short positions are forcibly closed, the accompanying buying adds upward pressure in a self-reinforcing loop that often fades once the squeezed positions are cleared.
In the most recent hour, the picture flipped. Longs lost $193,090 versus $33,200 for shorts, suggesting two-sided volatility rather than a clean continuation.
Technical Positioning
ETH now sits above all four EMAs. The 20-period EMA is at $2,455.94, the 50-period at $2,438.36, the 100-period at $2,363.41, and the 200-period at $2,222.64. The range top near $2,560 has rejected every push since August 27, including a wick to $2,555 on August 28 that failed to hold. With the weekly close approaching and the September Fed decision pending, the test of that ceiling — and whether ETF inflows persist — is the main thing to watch from here.
